Captain Hook - How (not) to look for vulnerabilities in Java applications
Looking to improve your skills? Discover our trainings sessions! Learn more.
What a great time to hunt for vulnerabilities in Java applications! For the past few months, I have been trying to build a tool, named Captain Hook, using a dynamic approach to find some interesting (security-wise) features of large closed-source Java applications. Along the way, I was able to try a number of instrumentation tools and techniques, and had a hard time finding one which satisfied all my needs. In this article, I will sum-up what I've learned through my many (some failed, some successful) attempts.
Captain Hook is available on GitHub.
Requirements
As Captain Hook was to be used by Synacktiv experts while hunting for vulnerabilities in large Java projects, it should:
- Be easy to set up on a target application.
- Be easy to use, intuitive.
- Not cook a list of vulnerabilities for us, rather point the analyst towards a shady functionality of the application, so that he could focus on it.
My colleagues and I thus set the goal of the tool to be able to trace arbitrary method calls, logging those which are interesting along with their stack traces and inputs to the expert, as well as distinguish whether an input for a method call was user-controlled or not. What to log or not should be customizable, and default to a set of commonly dangerous native Java methods.
The Java applications I want to analyze sometimes require a heavy and complicated setup; some run exclusively on Windows, some need a specific version of Java, etc. From this, I thought it would be easier to set up the Java application in a virtual machine, a container or anywhere but the host machine. Moreover, in order for the tool to be as generic as possible, this one had to be independent of the target software's execution environment. By running the tool in its own component, it should indeed be possible to make it agnostic of the targeted software's requirements, such as the required operating system. Thus, I chose to develop my tool in a Docker container, remotely connected to the Java Virtual Machine running the Java application under investigation.
Pure Java agents
Java provides a native mechanism for instrumenting the Java Virtual Machine. According to the official Java documentation:
Provides services that allow Java programming language agents to instrument programs running on the JVM. The mechanism for instrumentation is modification of the byte-codes of methods.
package java.lang.instrument
I thought this was going to be my main tool, but I quickly realized that many libraries are written over this mechanism, in order to program things at a higher level and get more meaningful errors. This will be developed later on in this article.
First contact with the project
When I was first given the subject, I was not at all familiar with the concept of instrumentation. I had practiced Java at school, and had a basic understanding of the inside gears of the Java Virtual Machine, but that was it. So, I started learning about the different instrumentation mechanisms in Java, and quickly directed my attention towards a couple of projects:
- Frida, probably the most famous instrumentation framework, with support for the Dalvik Virtual Machine (for android applications) for a few years, and recent support for the Hotspot Virtual Machine allowing to instrument Java applications running on standard desktop computers. A frida-agent is injected in the Java process, which allows us to execute code in the JVM through Javascript bindings;
- ByteMan, an intuitive instrumentation framework, based on the native instrumentation mechanism provided by Java. It uses a custom scripting language to describe the actions you want to run once the agent is loaded;
- ByteBuddy, an advanced, powerful, more customizable native instrumentation framework. The agent is written in Java, using ByteBuddy's classes and methods.
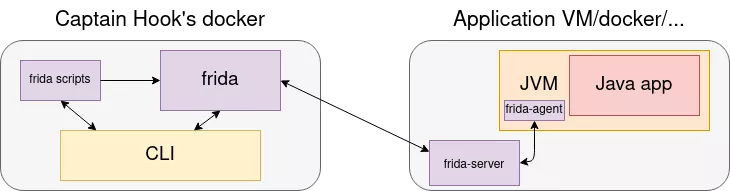
Using Frida, my setup would be to install frida-server on the application VM, to connect from Captain Hook's docker and inject Frida scripts, like this:
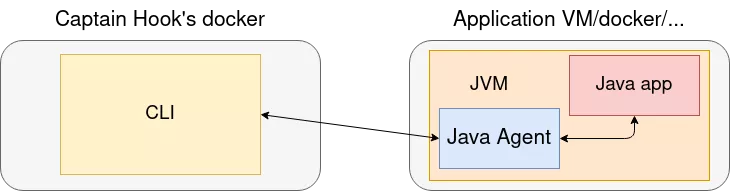
Using native Java agents, the compiled agent should be copied to the application VM, and injected from here in the running JVM. It could then be controlled by the CLI, for example using TCP sockets:
I thought that these would be all the tools I could ever need in order to have that dynamic approach to vulnerability research in Java applications.
But wait... how do you ease the discovery of vulnerabilities?
Objective 0 - Selecting a typical target
In order to create a tool which will help auditors discover vulnerabilities in large, closed-source Java applications, one big part is identifying a typical "large, closed-source Java application" and try to rediscover a public vulnerability using my tool. I had set up multiple applications in Docker containers, including Atlassian Jira & Confluence, ManageEngine OPManager, Oracle WebLogic and Jenkins. I finally chose to focus on rediscovering the exploit chain used by Orange Tsai on Jenkins, as this was the most documented vulnerability I came across and was easily reproducible. This exploit chain leads to a pre-authentication Remote Code Execution (RCE) in versions of Jenkins lower than 2.138. Throughout the different phases of development of my tool, I made sure the performance were okay on Jenkins, and that it was possible to discover the RCE (not the full chain) using my tool.
Objective 1 - A complete stacktrace
Let's say you want to find an RCE in a Java web application. To detect a potential one, you should monitor the calls to the exec method of the java.lang.Runtime class. This can be done quite easily with the three tools I previously mentioned, as shown :
- with Frida:
Java.perform(function () {
    var runtimeClass = Java.use("java.lang.Runtime");
    runtimeClass.exec.overload("java.lang.String").implementation = function () {
        send("java.lang.Runtime exec called!");
        this.execute();
    };
});
- with ByteMan:
RULE trace exec entry
CLASS java.lang.Runtime
METHOD exec(java.lang.String)
AT ENTRY
IF true
DO traceln("java.lang.Runtime exec called!")
ENDRULE
- with ByteBuddy:
public class Agent {

    public static void agentmain(String agentArgs, Instrumentation inst) {
        AgentBuilder mybuilder = new AgentBuilder.Default()
        .disableClassFormatChanges()
        .with(RedefinitionStrategy.RETRANSFORMATION)
        .with(InitializationStrategy.NoOp.INSTANCE)
        .with(TypeStrategy.Default.REDEFINE);
        mybuilder.type(nameMatches("java.lang.Runtime"))
        .transform((builder, type, classLoader, module) -> {
            try {
                return builder
                .visit(Advice.to(TraceAdvice.class)
                    .on(isMethod()
                        .and(nameMatches("exec"))
                    )
                );
            } catch (SecurityException e) {
                e.printStackTrace();
                return null;
            }
        }).installOn(inst);
    }
}


public class TraceAdvice {
    @Advice.OnMethodEnter
    static void onEnter(
        @Origin Method method,
    ) {
        System.out.println(method.getDeclaringClass().getName() + " " + method.getName() + " called!");
    }
}
Note that in a real scenario, all overloads of the exec method should be covered, which is only the case for the ByteBuddy example here.
But then, the user might wonder: "Where does the argument of exec come from?". And that is where things start to get funky, for it is quite easy to get a stacktrace from the beginning of the thread to the call to exec, but this stacktrace will not include the arguments of the parent calls. To clarify this idea, let me introduce you to my test program. It is a simple echo application, which I used intensively throughout the development of the tool. It is really fast to launch compared to the typical targets I mentioned earlier, and this was life-saving, as I cannot count the number of times I caused a crash in the JVM...
import java.io.*;
import java.util.*;

public class Main {

    public static void a(String s) {
        System.out.println(s);
    }

    public static void a(String s, String t) {
        if ("hi".equals(s)) {
            System.out.println(t);
        }
        else {
            b(s);
        }
    }

    public static void b(String s) {
        a(s);
    }

    public static void main(String[] args) {
        Scanner myObj = new Scanner(System.in);
        while (true) {
            System.out.println("Type something");
            a(myObj.nextLine(), "test");
        }
    }
}
Using the three frameworks mentioned above and inspecting the calls to java.io.PrintStream println(java.lang.String), it is easy to get the following list:
Main main(java.lang.String[])Main a(java.lang.String, java.lang.String)Main b(java.lang.String)Main a(java.lang.String)java.io.PrintStream println(java.lang.String)
But after some digging in the javadoc as well as the documentation of the three frameworks, I could not figure out an easy way to get the following list:
Main main([])Main a("Hello", "test")Main b("Hello")Main a("Hello")java.io.PrintStream println("Hello")
So I ended up coding a dirty solution, which basically consisted in hooking every loaded method, to keep track of every argument passed to every method call. The cool thing was that I knew everything that was happening in the JVM. The bad thing is, you guessed it, it worked okay-ish on my echo program, but, when it came the time to test it on a real target, it was purely unusable.
I abandoned ByteMan early in the process because I did not see the possibility of calling arbitrary code and modifying methods arguments at the time. Also, trying to develop each feature of my tool three times with three different frameworks was a bit heavy, and I preferred keeping only the more promising two at the time (I abandoned ByteBuddy as well soon after). Retrospectively, I think that I should have spent more time fiddling with it, as it might have met my needs if I had mastered it.
Back to the main problem: having a complete stacktrace. I remember getting stuck for quite a while on this topic, until a colleague told me to take inspiration from what Java IDEs are doing. Indeed, some of them are capable of printing such a stacktrace. So I started researching on how these debuggers do this kind of magic. And here I discovered what would become my main tool for the rest of this project : the Java Debug Interface. It is not strictly speaking instrumentation, but it is capable of doing exactly what I wanted.
According to the official Java documentation:
The Java Debug Interface (JDI) is a high level Java API providing information useful for debuggers and similar systems needing access to the running state of a (usually remote) virtual machine. JDI provides introspective access to a running virtual machine's state, Class, Array, Interface, and primitive types, and instances of those types. JDI also provides explicit control over a virtual machine's execution. The ability to suspend and resume threads, to set breakpoints, [...] and the ability to inspect a suspended thread's state, local variables, stack backtrace, etc.
The only drawback was that the JVM running the application to analyze needed to be started with a couple of command-line arguments. This slightly increased the complexity of the setup, but most of the mainstream java applications provide a config file in which one can specify additional JVM start-up options.
So I wrote a Java program, acting like a debugger, which communicated over UNIX sockets to my main CLI (written in Python), and the process was easy :
- Set a breakpoint on the desired methods;
- When the breakpoint hits, call a set of Java Debug Interface methods to retrieve the parent calls and arguments to these calls;
- Resume the JVM.
That approach performed much better than the two mentioned above, and allowed me to display the information that I wanted through the CLI.
At this point, it was time for me to abandon ByteBuddy. Indeed, I did not see the point in keeping it, as Frida was also capable of reimplementing methods of my choice. Little did I know that this functionality would cause me so much trouble...
Objective 2 - Object inspection
Having a complete stacktrace is cool, but what if the argument passed to the method you are interested in (or any of its parents) is an instance of org.eclipse.jetty.server.Request ? You cannot just print it and show it to the auditor. It is composed of many instance variables, each one being either a "simple" type (and by that I mean, which you can directly print) or a complex object itself.
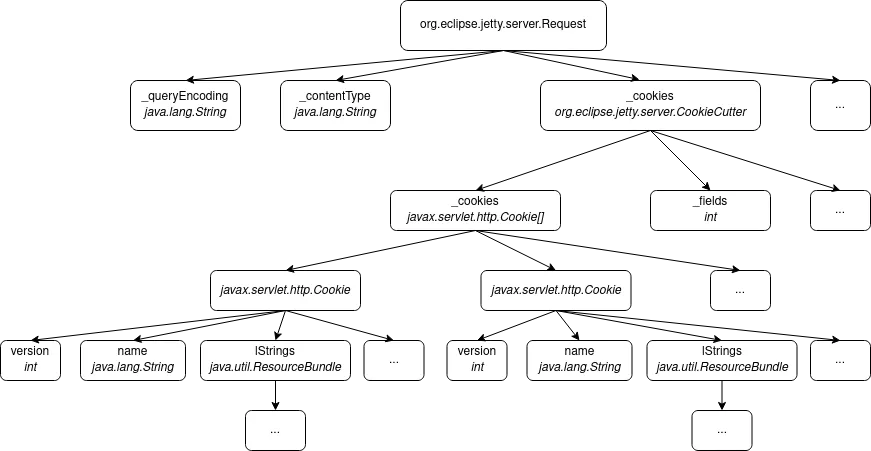
Once again, the Java Debug Interface was there to the rescue. When a breakpoint hits, each argument is retrieved in the form of an object implementing the com.sun.jdi.Value interface in my debugger, which is a reference to the actual object in the virtual machine. That reference is valid as long as the object is not garbage collected in the main JVM. The Java Debug Interface provides a set of methods and attributes on Value objects, which allowed me to recursively get references to complex objects' attributes and output each object in JSON format using Jackson, a popular Java library for JSON formatting and object inspection.
With that done, my tool gave the auditor the ability to thoroughly inspect the call stack when passing through a suspicious method, thus understanding the origin of the call as well as the manipulations being done over the data that he fed through the application.
Objective 3 - Reimplement methods
What if the stacktrace looked something like this:
input()executeSafe(userData)execute(userDataSanitized)
I wanted my tool to be as convenient as possible for the auditor, and as such, I thought it would be cool to be able to change the implementation of any method. In the previous example, it could be interesting to rewrite the executeSafe method so that it calls execute directly on user input, without the sanitizing part. Frida is the perfect tool for that, so I decided to use it, in combination with the Java Debug Interface. The architecture of the tool looked like this:
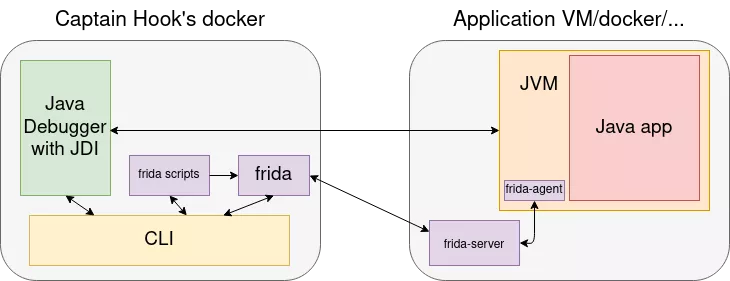
Here, I found myself hitting another wall: the Java Debug Interface acts at the bytecode level (in the JVM), whereas the frida-agent acts at the native code level (modifying the program flow and memory of the JVM process, at the OS level). Therefore, the combination of the two is prone to crashing the JVM. As the internals of the Frida bindings for Java are, currently, still undocumented, I spent a long time debugging this issue, and finally found that the conflict occurred when using Frida to reimplement a method on which a breakpoint was set (no matter the order of the two). This was a deeply rooted problem, for which I did not find a solution at the time, so I put this objective aside and moved on.
Objective 4 - Execute arbitrary code on the main JVM
I was nonetheless hyped by the possibilities offered by Frida, and wanted to keep it in my project. This would be helpful for instance to fuzz a filter method, by injecting a script like that:
Java.perform(function () {
    var myList = ["fuz1z", "fuz2z", "fuz3z"];
    var myClass = Java.use("my.Class");
    var myMethod = myClass.filter.overload("java.lang.String")
    for (var i=0; i<myList.length; i++) {
        myResult = myMethod.invoke(myList[i]);
        if (myResult.indexOf("fuzz") > -1) {
            send(myList[i] + " bypasses the filter!");
        }
    }
});
I thus added a feature to inject an arbitrary Frida script in the JVM, with a big warning in the documentation of this feature regarding reimplementing methods. This was easily achieved and tested.
As I wanted to keep the setup process as easy as possible, this feature is optional and the rest of the features of the tool run totally fine if Frida is not installed and listening on the main machine.
Objective 3, the return - Set the arguments of method calls, mock methods
A few weeks before the end of my internship, I had the idea to reintroduce ByteBuddy to revive my third objective, about reimplementing methods. I wanted to see if it was compatible with the Java Debug Interface.
ByteBuddy is a Java library which was built to simplify the creation of a native Java agent. A native Java agent is a Java program, whose job is to transform the bytecode of a given class or method at runtime, in the JVM. It can be attached to the JVM at startup, or after. ByteBuddy offer classes and methods, which are wrappers for libraries (such as ASM) which are themselves wrappers for native Java bytecode-transformer methods.
In order to reimplement methods, I created a simple agent using ByteBuddy, and bundled the ByteBuddy dependencies in the agent JAR file thanks to the maven-assembly plugin for Maven. This plugin is made for classic JAR files, not agents, so I had to manually modify the MANIFEST.MF after the build to add the entries required for an agent to run. I then installed the agent manually on the target machine, and loaded it in the JVM. This allowed me to experiment with the compatibility between ByteBuddy and the Java Debug Interface, which seemed great.
Then, I remembered I wanted to keep the setup simple. That was not going to be easy, as the agent JAR file must be on the host machine to be injected in the JVM. I know that when we encounter a Java Debug Wire Protocol (the port used by the Java Debug Interface) service listening on an open port during a security assessment, we can easily get a shell from it. I thus programmed my debugger to grab a shell when possible, and send the ByteBuddy agent and launcher JAR files to the host machine. When this is done, the debugger starts the launcher JAR, which injects the agent in the main JVM.
This is where I stopped. This feature is still in development and needs heavy work to be operational, but this proof of concept gave me confidence regarding its feasability.
Now what?
During my internship, I lost a lot of time in development because of bad design choices. For instance, the communication mechanism between the Java debugger and the Python CLI was first written using Frida; a frida-agent was injected in the Java debugger, which allowed the Python CLI to have control over what the debugger was doing. I chose to proceed this way at first because I thought that it would be easier to use Frida for everything in my tool, but quickly realized that the communication was deeply oriented, from the CLI to the debugger. Passing messages the other way around was really complex, and I ended up spawning a thread in the CLI only to actively poll the debugger from time to time and get its messages, which is a terrible design. Finally, I took a step back and rebuilt the communication mechanism between the CLI and the debugger from scratch to be socket-based, and this solved my issues as well as improved the overall stability of the tool.
As of today, the tool is usable. It gives valuable feedback towards finding a vulnerability in a Java application, and I am not aware of any other tool assisting a researcher following a dynamic approach specifically for finding vulnerabilities in these applications. Developing this tool taught me many things regarding the internals of the Java Virtual Machine and the Java language, and these acquired skills will help me sharpen Synacktiv's tool set in the future. While Captain Hook is not ready to become the next industry standard, it is a good start in a domain still full of surprises as of January 2022, with the recent discovery of the Log4j vulnerabilities.