Frinet: reverse-engineering made easier
By combining Frida with an enhanced version of Tenet, Frinet facilitates the study of large programs, vulnerability research and root-cause analysis on iOS, Android, Linux, Windows, and most architectures.
Looking to improve your skills? Discover our trainings sessions! Learn more.
When reverse-engineering native software implementations, two main approaches are used:
- Static analysis, the direct study of the raw binary through disassemblers and decompilers such as IDA Pro or Ghidra;
- Dynamic analysis, focusing on following the code live through emulation or debugging.
Both of these approaches have pros and cons. Stepping through code with a debugger gives the possibility to inspect actual values taken by any data structure without having to look at dozens of functions executed before. It also helps in following which branches are taken by the code, which can sometimes be hard to determine. However, most of the time, live dynamic analysis provided by a debugger does not allow seeing the big picture, and focuses on details instead. On the other hand, static analysis can grant a better understanding of the program as a whole, because navigation across functions and cross-references is often a lot easier.
One approach combines the advantages of dynamic and static analysis: execution trace exploration. By executing a function once and saving most of the relevant information a debugger would provide – register values as well as memory read and write accesses – then loading this execution trace through a plugin in a disassembler, it becomes possible to enhance the static analysis experience. This method provides contextual information such as memory and register values, while not compromising on speed and ease of navigation. Indeed, once an execution trace has been made, there is no need to setup the same scenario over and over because of a skipped breakpoint or any other inconvenience.
This approach has existed for a long time, but in our knowledge, public tools did not grant enough ease of use to make it practical in most scenarios. That is until Markus Gaasedelen released his tool Tenet1, an IDA Pro plugin providing easy-to-use trace exploration capabilities.
Tenet execution trace viewer
The Tenet plugin won first place in Hex-Rays' 2021 Plug-In Contest2, and for good reason : the plugin is very easy and intuitive to use, even more so than the base IDA interface. As such, there is very little to learn in order to use it productively. We won't go into the details of how to use the base version of the plugin in this blogpost, because the author already made a very nice summary of the most relevant features, complete with animations, illustrations, and examples : https://blog.ret2.io/2021/04/20/tenet-trace-explorer/.
After explaining how our custom tracer works, we will present the features added to our version of the Tenet plugin.
Frinet Frida tracer
At multiple occasions when trying to use the plugin, the main issue encountered was execution trace generation. The official tracing methods are listed: https://github.com/gaasedelen/tenet/tree/master/tracers. As stated on the page, it is not supposed to be ready to use in most scenarios:
“At this time, Tenet has mostly been used to explore traces that were generated from snapshot-based fuzzers. These are perhaps the most immediate, real-world use case for this technology until additional investments are made to scale it further.”
On complex multithreaded targets, using Intel PIN to record everything is often not effective. Furthermore, nothing generic was provided for different architectures. The Tenet plugin itself does not even officially support anything else than x86, even though it is pretty much architecture-agnostic and adding other architectures to it is very straightforward. This same issue on the trace generation side is not so easily solved. A trace generation solution that would work on many architectures and could be used on an isolated function call would make the plugin useful in most reverse-engineering scenarios. This is where Frida Stalker comes in: by rewriting code on the fly, this feature can be used to execute a callback on every CPU instruction executed. It supports many architectures, including ARM and ARM64, and can easily be used to trace only one specific function. An example would be tracing only the execution of a certificate parsing function in a huge software containing many other features all running at the same time. As well as running on several architectures, Frida is also compatible with Windows, Linux, iOS and Android, making trace generation available on all those platforms.
Frida Stalker - Javascript
The feature is documented on the official Frida API: https://frida.re/docs/javascript-api/#stalker. In the tool, we first setup an Interceptor on the target function. In the onEnter callback, Stalker is used the following way: Stalker.follow(this.threadId, {transform: js_transform}). At execution, the first time a basic block is encountered by the Stalker, this transform function is called to modify the behavior of the execution of this specific block. In our tool, for every instruction, a callback is set up to testcb, a function that will log the current context.
transform(iterator)
{
    let instruction = iterator.next();
    do {
            // [...]
            iterator.putCallout(function(context) {
                testcb(context, read, write);
            });
        }
        iterator.keep();
    } while ((instruction = iterator.next()) !== null);
}
The callback then executes for each executed instruction, and every register and memory read/write values are sent to the Python main script, which writes an execution trace in the Tenet text format. There are many additional details in the actual implementation, but this is the most important part. Stalker is a very powerful tool that can be used for many other interesting applications.
Frida Stalker - Native callbacks
Reading the documentation of the Stalker feature, this part seemed interesting :
// Want better performance? Write the callbacks in C:

const cm = new CModule(\`
#include <gum/gumstalker.h>
...
This explains how to use the same Stalker feature, the same way as described above, but using C-based callbacks instead of JavaScript-based callbacks. Knowing that we want execution of the callback on every instruction in the context of a tracer, using faster native code is obviously a better solution. However, this solution comes at a price : It is not as architecture agnostic as the JavaScript one, and is also harder to implement correctly. Despite those minor setbacks, we were able to implement optimized Stalker modules for x86, x86-64, and ARM64. The base JavaScript tracer is still usable if some bug is encountered in an optimized one. The use of the JavaScript tracer can be forced with the --slow flag.
If native crashes happen with both the native and JavaScript tracers, the issue probably stems from Frida's Stalker implementation : this feature is not perfect, and we encountered some specific scenarios where it had issues. Nonetheless, it has been working perfectly most of the time on real targets during security assessments. We observed tracing speeds of around 400,000 instructions per second on our daily targets, but this is not a proper benchmark.
Frinet Tenet viewer
While developing this tool, we also modified the Tenet plugin. A few minor changes were made to the existing views, including the addition of several memory views and some additional contextual options, but two major features were also added. The plugin is also now able to get the ASLR slide offset directly from the first line of the trace. This is relevant because the embedded automatic ASLR slide detection sometimes fails.
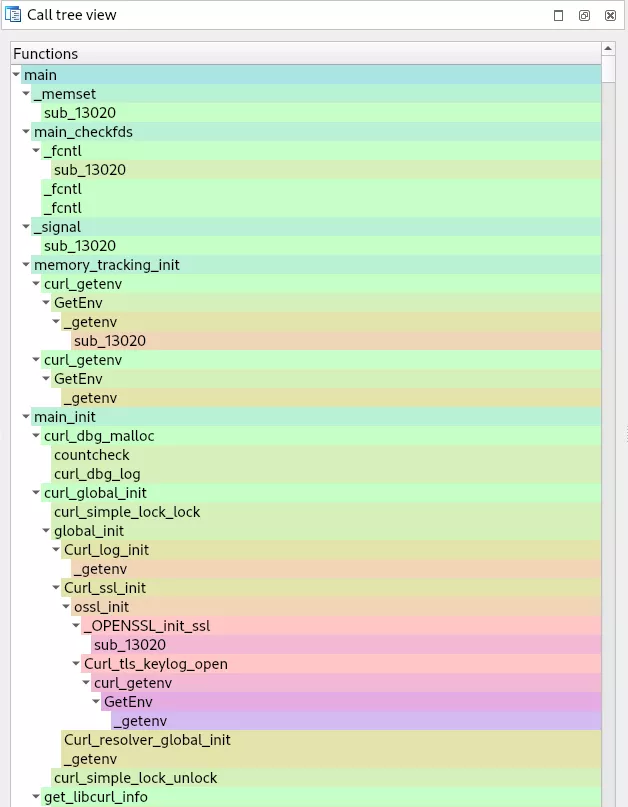
Call Tree view
The biggest deviation from the original plugin is the addition of the Call Tree view. It is a global overview of called functions, similar to a stack trace but spanning the entire execution trace, represented in clickable nodes that can be expanded and reduced. It is useful in the context of reverse-engineering, especially for parsing functions calling many parsing sub-functions dynamically, such as ASN1 parsers. Furthermore, it is also especially useful in the context of C++ virtual calls or in the presence of indirect calls in general, where following the program flow statically is difficult. The Call Tree view can be filtered using regex if some functions are called often, making it hard to read (for example : malloc, log prints…), or if only a subset of functions respecting some naming convention is relevant to the study. This is done through right-click → Filter in the contextual menu. It is also possible to only expand relevant function calls by right-clicking a node and choosing Collapse all but selection. This makes the stack trace leading to this specific node easier to see, even in the case of very complex trees.
This view is still experimental, and issues can arise especially on untested architectures, but it seems to work relatively well on ARM64 and x86-64 traces in real life scenarios. It only uses heuristics related to the instruction pointer to detect calls, and as such it is relatively architecture-agnostic.
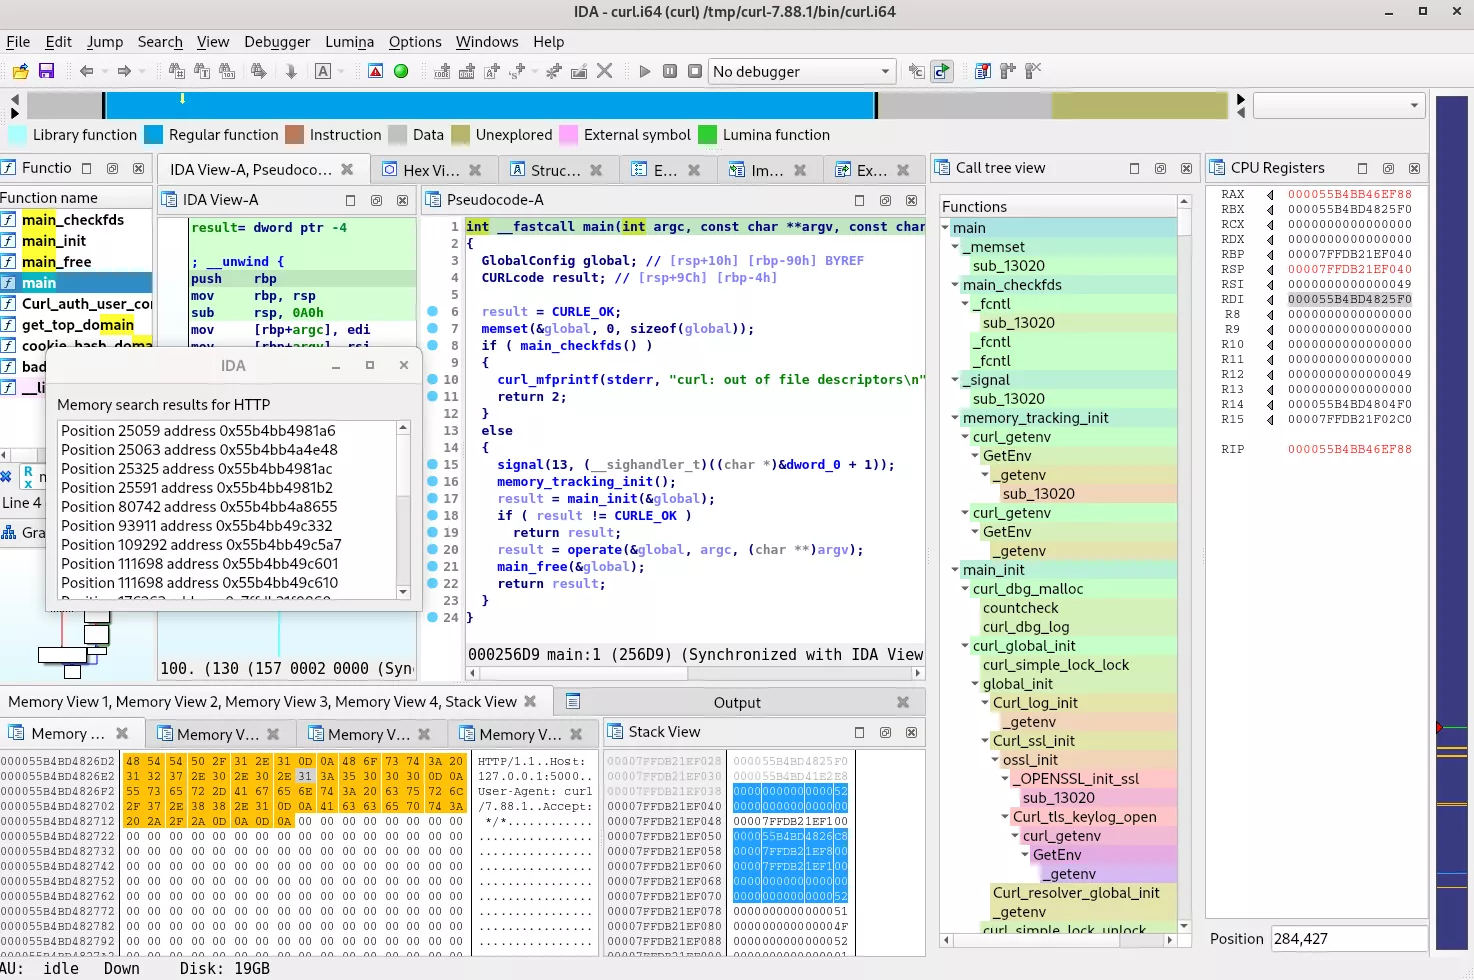
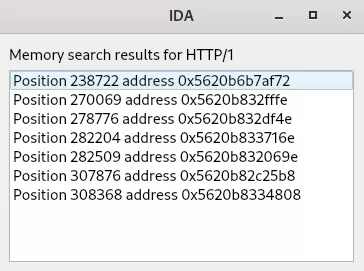
Memory Search
Because the memory contents potentially change at each instruction in the trace, there needs to be a special representation of the data that accounts for the potential values of bytes at every point in time. Such a memory representation was added to Tenet, granting the ability to search for any sequence of bytes in the accessed memory, wherever in time the sequence exists. This feature can be accessed by right-clicking a Memory View and choosing Search bytes in the contextual menu. Search results are then presented to the user in a new window, and can be clicked, making a direct jump to the occurrence that was found.
Demonstration
For demonstration purposes, a curl build version 7.88.1 was compiled on Debian. This demonstration is done on x86_64 for convenience, but could have been on ARM/ARM64 and not much would have changed. The following build configuration was used : ./configure --enable-debug -with-openssl --prefix=/tmp/curl-7.88.1 --disable-shared.
After locating the offset of main in IDA, the following command was used to generate a trace of the main function of curl:
user@debian:~/frinet/tracer$ python3 trace.py spawn /tmp/curl-7.88.1/bin/curl curl 0x256d9 -a "curl,-k,https://127.0.0.1:5000/test"
2023-11-21 17:28:15,139     INFO | Using local device
2023-11-21 17:28:15,142     INFO | Connected to device (x64 linux Debian GNU/Linux 12).
2023-11-21 17:28:15,145     INFO | Spawning process
2023-11-21 17:28:15,179     INFO | Loading JS module...
2023-11-21 17:28:15,183     INFO | Loading C module...
2023-11-21 17:28:15,184     INFO | Tracing...
2023-11-21 17:28:15,185     INFO | Received ASLR slide: 0x55793cfb4000.
2023-11-21 17:28:15,188     INFO | CTRL+C to interrupt trace
Entering function
2023-11-21 17:28:15,336     INFO | Received trace data for new thread 148030.
2023-11-21 17:28:15,337     INFO | Writing trace data of 1048261 bytes...
2023-11-21 17:28:15,440     INFO | Writing trace data of 1048600 bytes...
2023-11-21 17:28:15,555     INFO | Writing trace data of 1048576 bytes...
...
2023-11-21 17:28:30,781     INFO | Writing trace data of 1035407 bytes...
STDOUT : <html><body>
STDOUT : <h1>hello</h1>
STDOUT : </body></html>
2023-11-21 17:28:30,873     INFO | Writing trace data of 1038204 bytes...
2023-11-21 17:28:30,987     INFO | Writing trace data of 1027347 bytes...
Leaving function
2023-11-21 17:28:31,026     INFO | Writing trace data of 488267 bytes...
...
user@debian:~/frinet/tracer$ cp traces/curl_1700478104_89808.tenet /tmp/curl-7.88.1/
In our environment, the trace was generated in approximately 16 seconds, as indicated in the timestamps.
The following video shows how to use the new features presented here to figure out where the curl request is sent in the trace, and where the header/content from the response is parsed:
Release
Our modified Tenet version is still compatible with legacy traces. However, the new features are still experimental, and some legacy feature such as the support for serialized traces were removed for the time being. As such, we did not make a pull request yet, but it will happen when the legacy features are reintroduced and more testing has been done, or if the plugin author is interested in having our new features introduced.
The GitHub repository for the Frinet project is available here : https://github.com/synacktiv/frinet