
AWS EKS forensics: data sources and investigation tooling
Investigating a compromise in Amazon EKS means piecing together evidence spread across three layers: the managed Kubernetes control plane, the worker nodes, and the surrounding AWS services. This article maps the data sources an EKS cluster exposes for digital forensics and threat hunting, and the tooling used to correlate them, from the Kubernetes audit log down to the AWS identity of the nodes.
Looking to improve your skills? Discover our trainings sessions! Learn more.
Part of our Kubernetes Forensics series, this article builds on 'Kubernetes Forensics 1/3: what the container' (container internals and an applied analysis methodology). For broader context, see also 'AWS Forensics: what you need to know', on investigation tooling across AWS.
Introduction
Kubernetes clusters now appear regularly in the incidents handled by the Synacktiv CSIRT. The technology is inherently complex: many interdependent components, and a significant abstraction layer in managed offerings, where the customer does not control the whole stack. Monitoring and security are frequently added late, which leaves responders with limited visibility once an intrusion has occurred. Those intrusions increasingly start at the application layer, a Helm template injection through a GitOps controller such as ArgoCD, for instance, can turn a chart value into workload execution inside the cluster (Paul Barbé, Charting your way in: Helm template injection, SSTIC 20261). This article does not revisit how a cluster is breached; it focuses on what the breach leaves behind and how to investigate it.
Kubernetes forensics also remains a relatively immature discipline, constrained by two structural factors: the volatility of the data (a deleted or restarted pod takes most of its state with it) and the difficulty of locating artefacts across large, distributed clusters. In practice, the outcome of an EKS investigation is largely decided before the incident, by the logging and monitoring that were put in place. This article summarises the data sources that Amazon EKS exposes and the tooling used to exploit them.
N.B. This article focuses on AWS-native data sources and tooling. Third-party runtime security solutions (Falco, Sysdig, Wiz, and similar) can materially improve in-container visibility but are out of scope here.
Amazon EKS in context
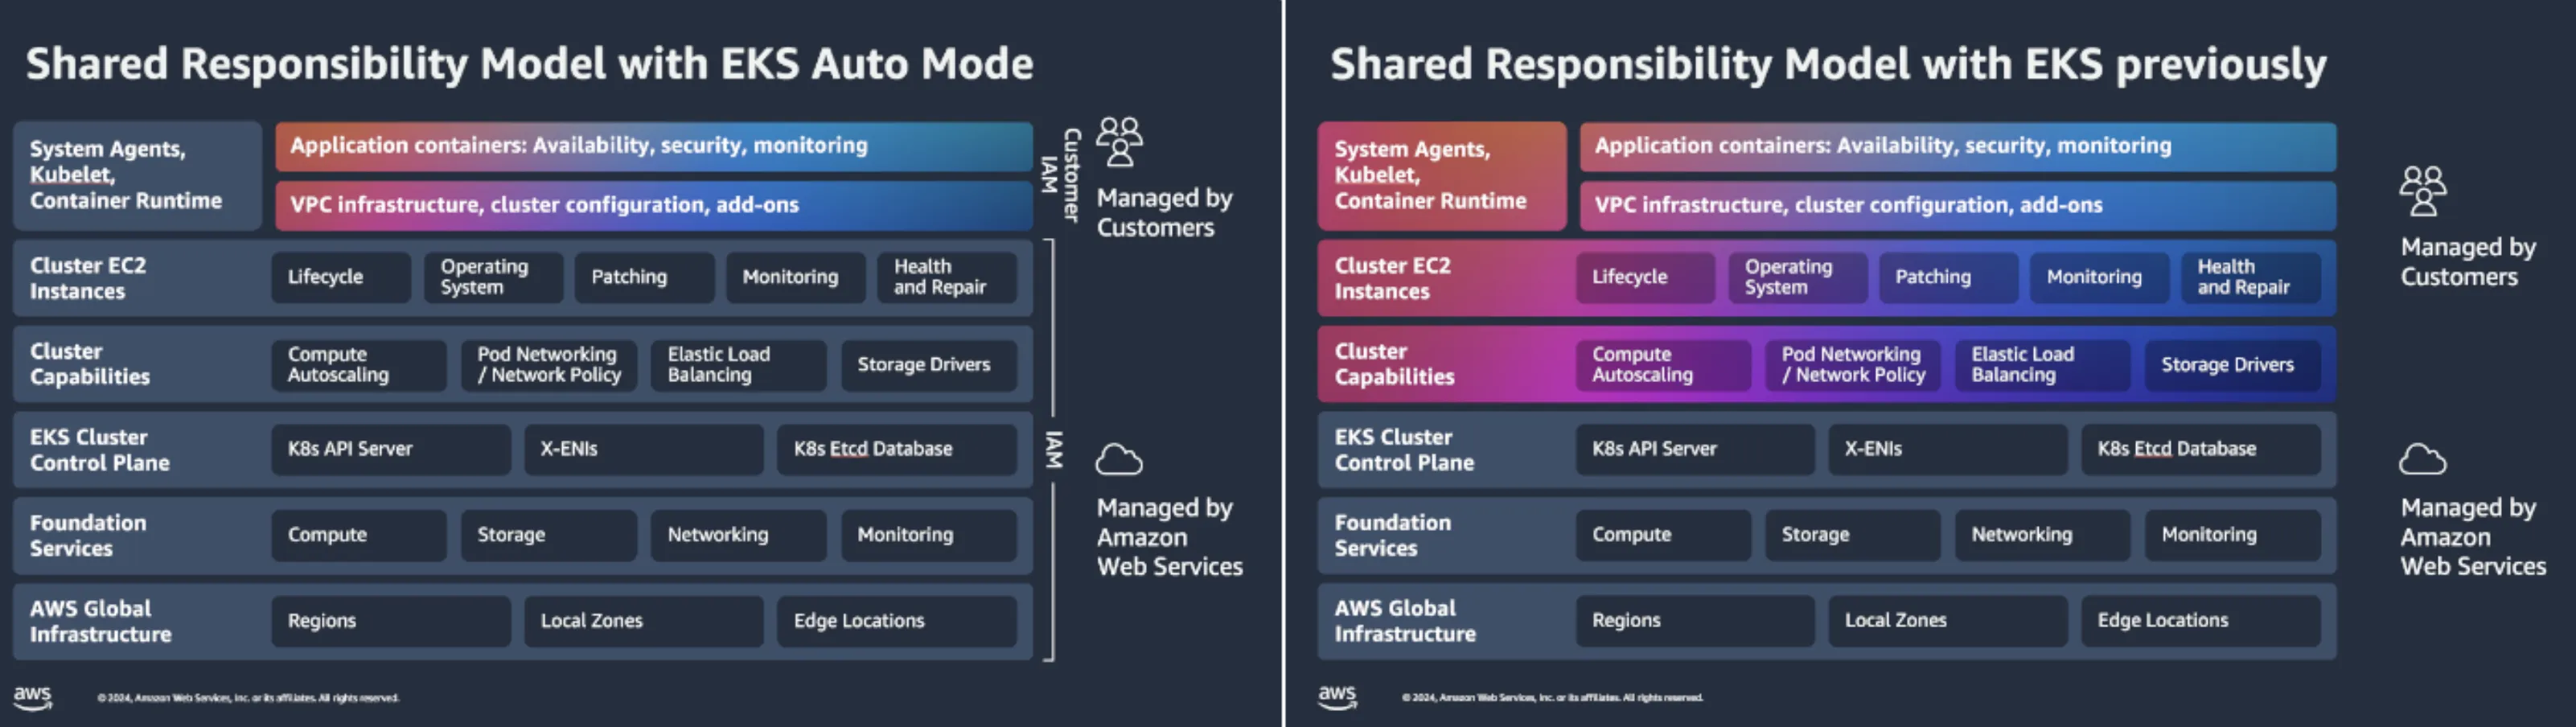
Amazon EKS is AWS's managed Kubernetes offering. The deployment mode determines how much access a responder has to the nodes, and therefore what can be collected:
| Mode | Worker management | Node access for forensics |
|---|---|---|
| Standard EKS (managed / self-managed node groups) | Customer (nodes are EC2) | SSH or SSM directly on the worker |
| EKS Auto Mode2 | AWS | Immutable Bottlerocket AMIs that disallow SSH/SSM; a privileged debug pod is required. Additionally, nodes have a maximum lifetime of 21 days. |
| Fargate3 | AWS (one micro-VM per pod) | Full abstraction of the host: no node access, and no way to run per-node agents (DaemonSets such as Fluent Bit or the GuardDuty runtime agent do not run on Fargate) |
On a standard cluster, the worker nodes are EC2 instances that a responder can reach over SSH or SSM; under Auto Mode or Fargate, the host is managed by AWS and direct node access is not available. Establishing the compute mode is therefore the first triage step, alongside a few practical questions: which telemetry is actually enabled (control plane audit logging, Container Insights, GuardDuty), and has the suspicious pod already been deleted or restarted, taking its state with it.
Data sources
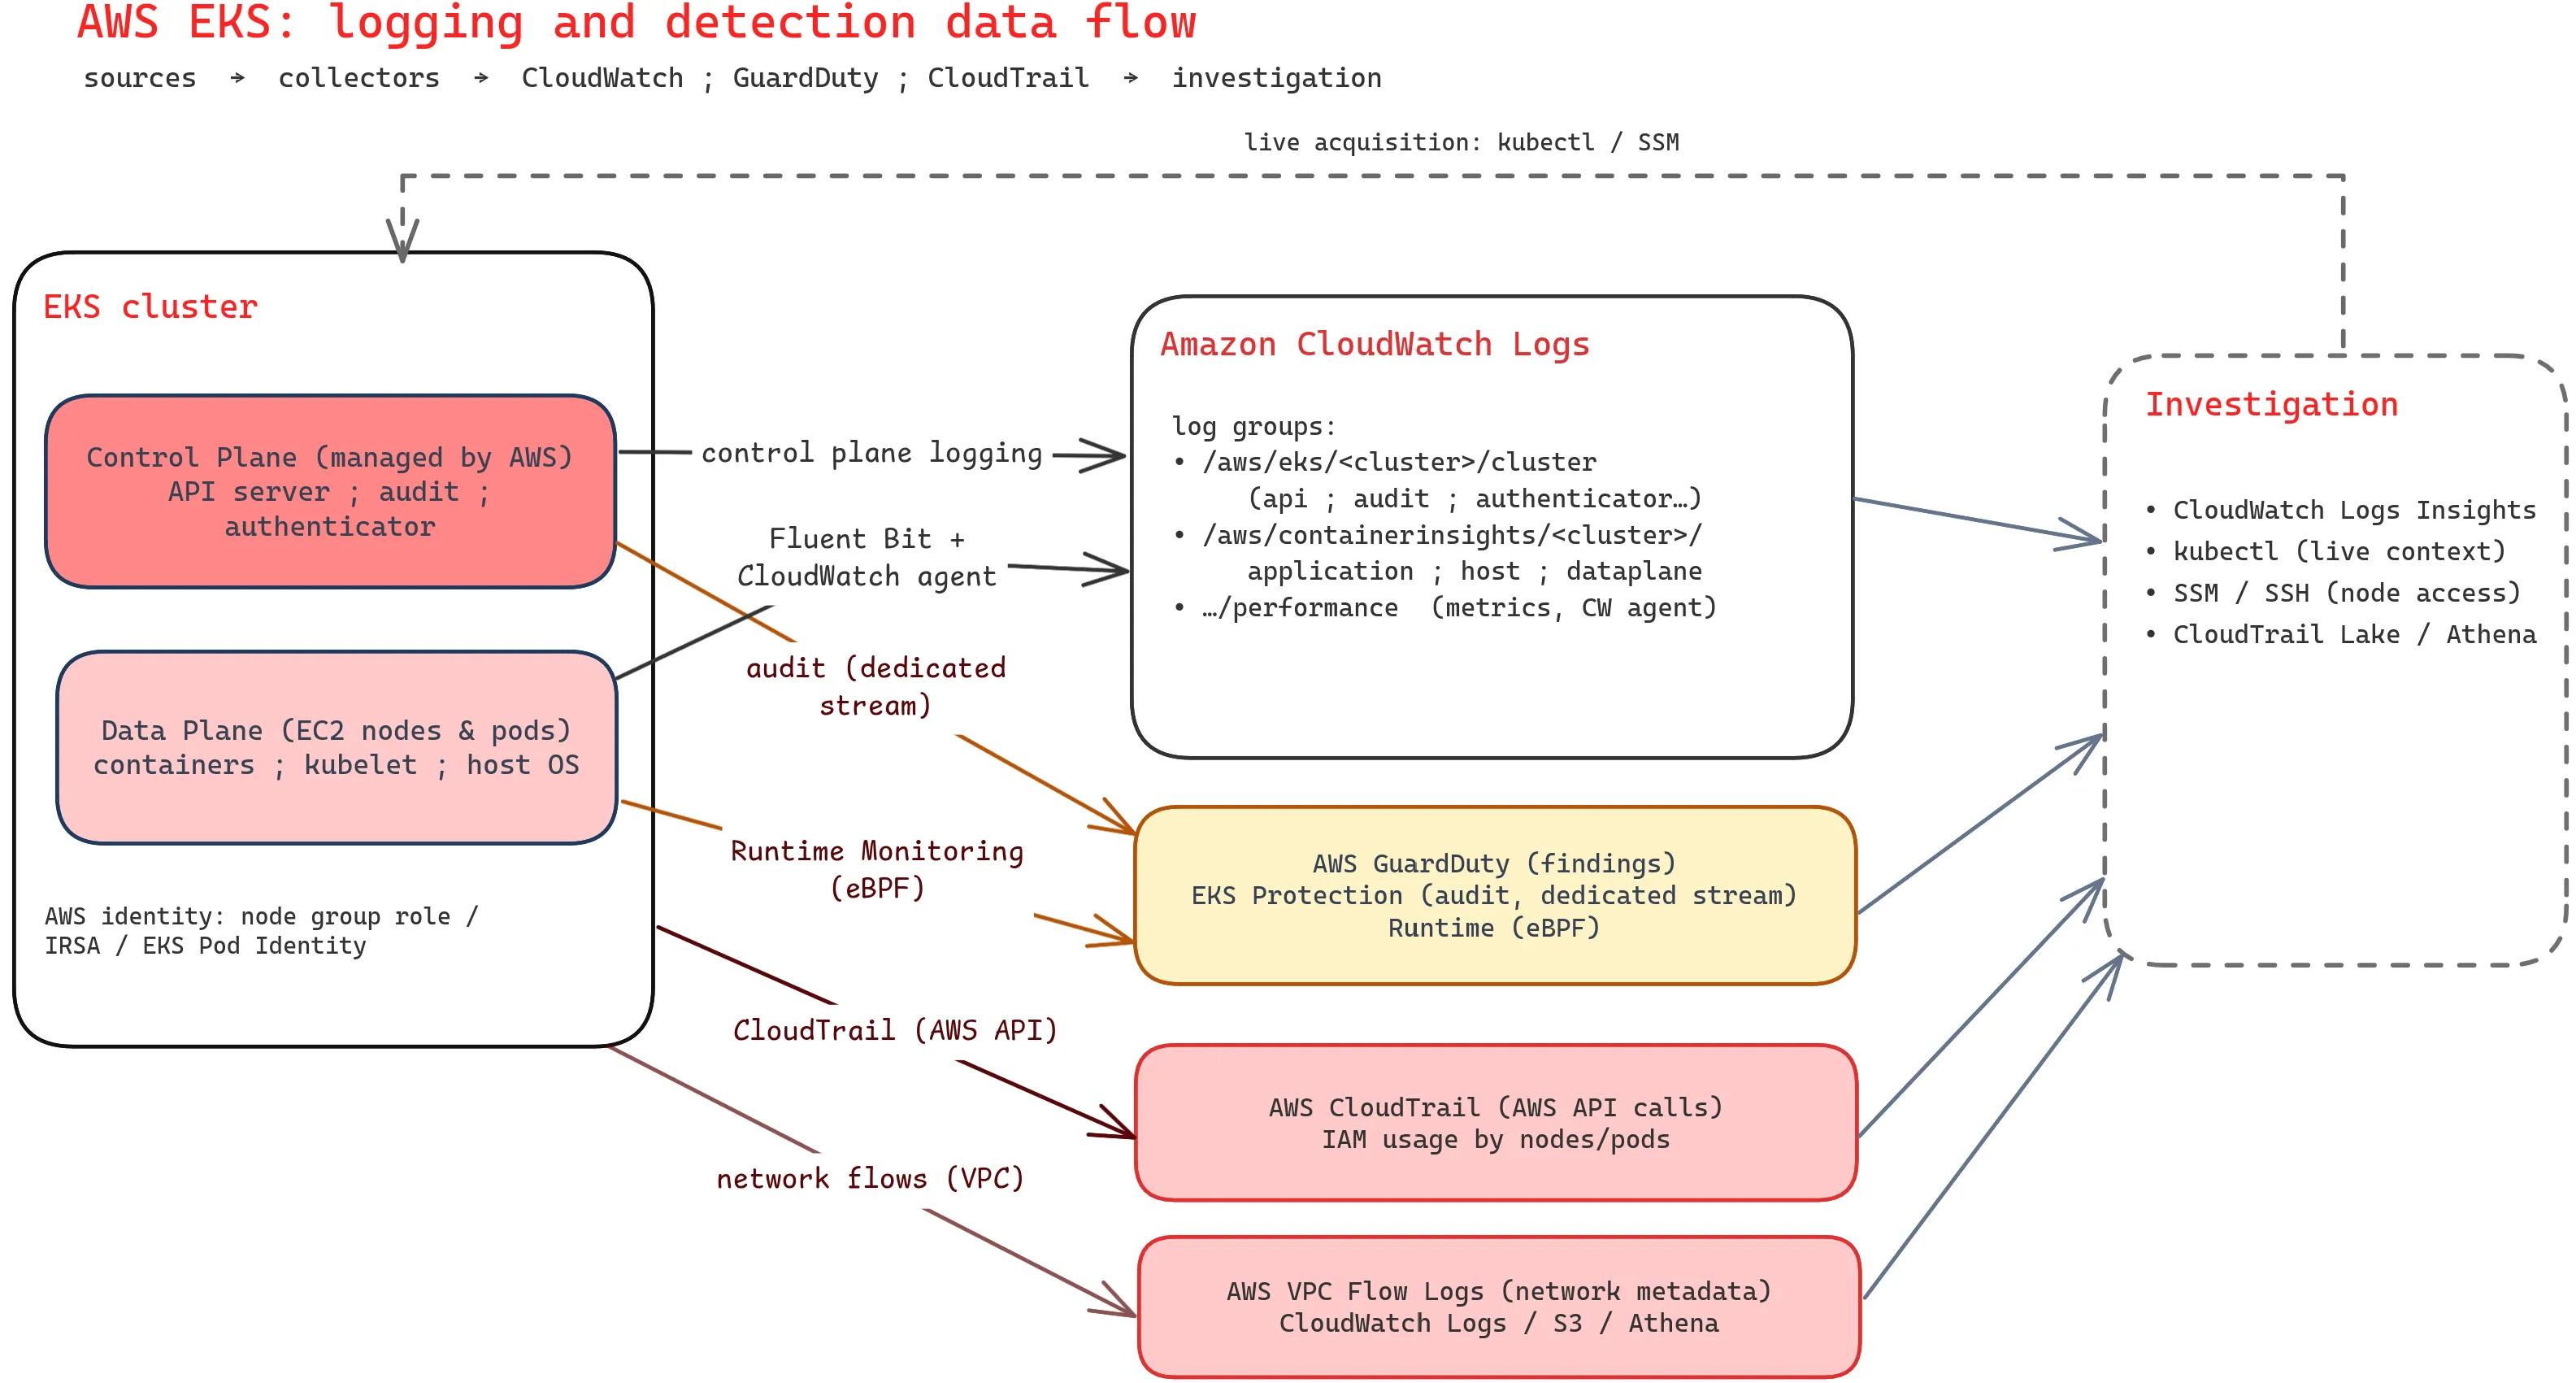
An EKS investigation draws on three families of logs, all of which can be centralised in CloudWatch: the Kubernetes control plane, the data plane (containers and hosts), and the surrounding AWS services.
Control plane logs
By default, none of these logs are enabled. Five log types are available and are turned on per-cluster through the control plane logging API4, exported at verbosity level 2, as the documentation suggests:
aws eks update-cluster-config --name <cluster> --region <region> \
  --logging '{"clusterLogging":[{"types":["api","audit","authenticator","controllerManager","scheduler"],"enabled":true}]}'
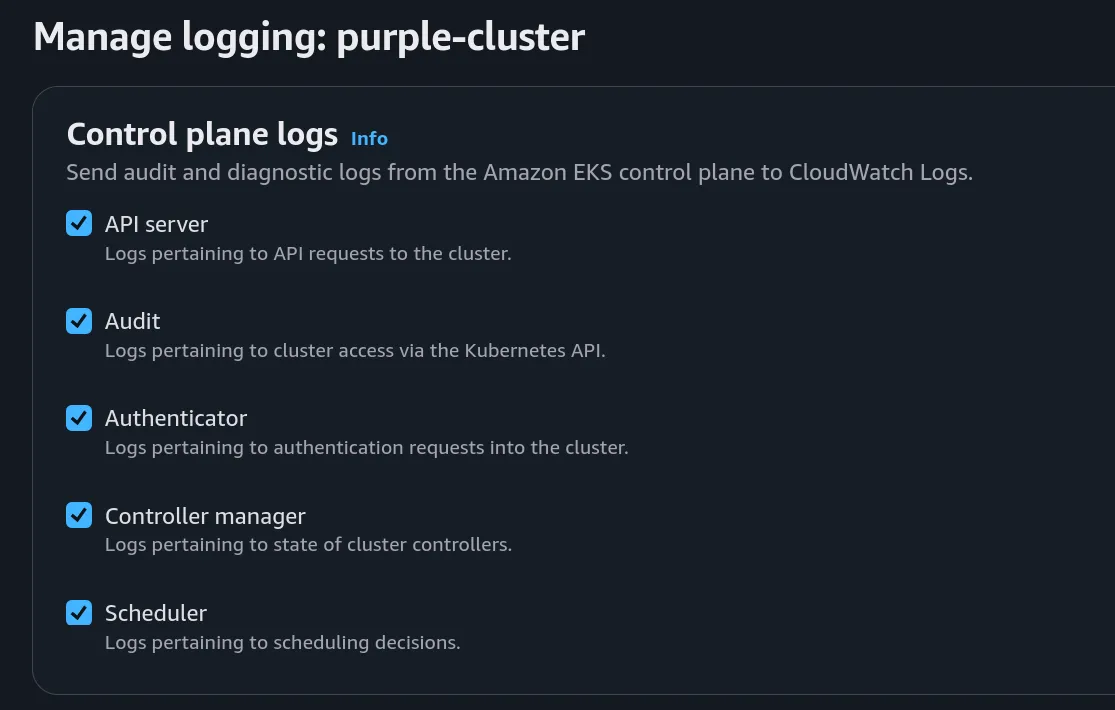
| Type | Content | DFIR value |
|---|---|---|
| api | Requests served by the API server (for example via kubectl) |
High |
| audit | Detailed audit trail: identity, verb, resource, requestObject |
Central |
| authenticator | Authentication (IAM ↔ RBAC mapping), specific to EKS | Medium |
| controllerManager / scheduler | Controller state and scheduling decisions | Low / very specific |
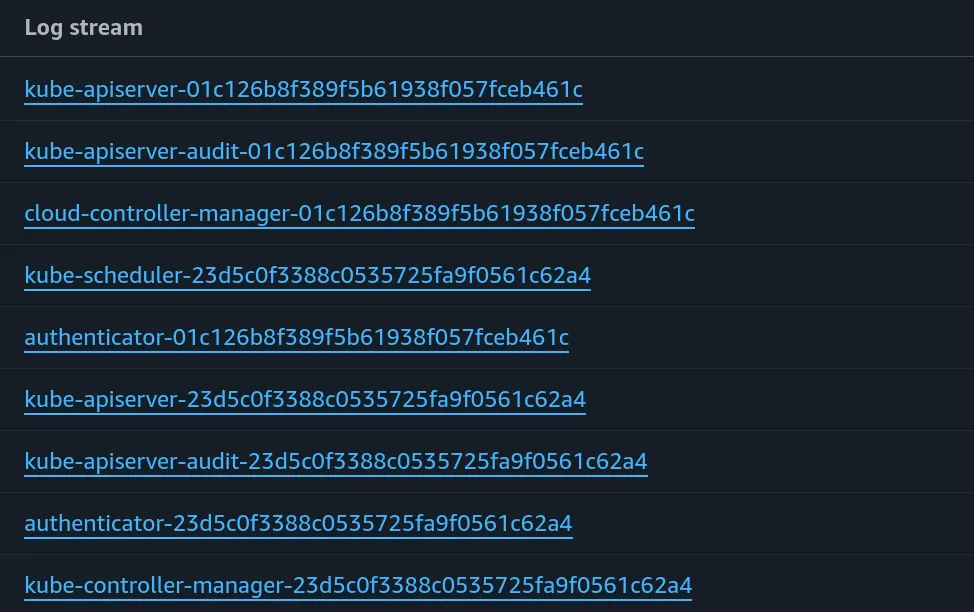
All five arrive in a single log group, /aws/eks/[cluster]/cluster, as separate log streams (kube-apiserver-audit-*, authenticator-*, and so on).
The audit log is the backbone of the investigation: it records who did what, on which resource, from which source IP address, and with which user agent. The relevant fields are user.username, verb, objectRef.resource, objectRef.namespace, objectRef.name, responseStatus.code, sourceIPs.0, userAgent and requestObject.*.
The requestObject content varies with the resource type involved. For a pod creation, for example, it captures the complete manifest submitted for the pod: image, command, environment variables, mounted volumes, and more. For a forensic analyst, that's a goldmine.
N.B. GuardDuty EKS Protection5 consumes EKS audit logs through its own independent stream, so enabling control plane audit logging to CloudWatch is not a prerequisite for GuardDuty, but it is still required for proper analysis and retention.
Data plane logs (Container Insights)
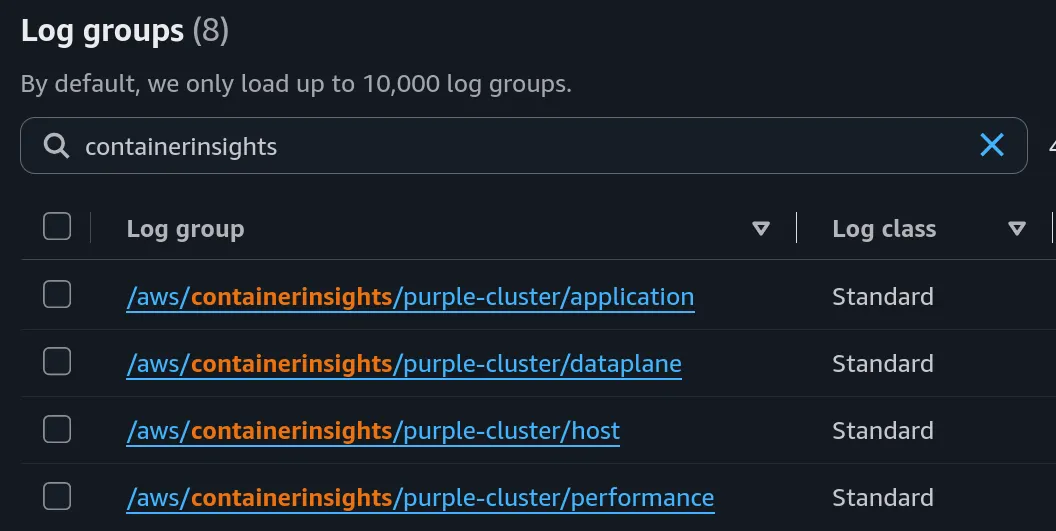
The amazon-cloudwatch-observability6 EKS add-on deploys the CloudWatch agent (metrics) and Fluent Bit7 (logs) as a DaemonSet. Fluent Bit ships data plane logs to three log groups:
| Log group | Source |
|---|---|
/aws/containerinsights/[cluster]/application |
Container logs from /var/log/containers (stdout/stderr) |
/aws/containerinsights/[cluster]/host |
Worker OS logs: /var/log/dmesg, /var/log/secure, /var/log/messages |
/aws/containerinsights/[cluster]/dataplane |
journald for kubelet, kube-proxy and the container runtime |
A fourth group, /aws/containerinsights/[cluster]/performance, holds system and network metrics; it is produced by the CloudWatch agent rather than Fluent Bit.
Container logs are enriched with Kubernetes metadata (kubernetes.namespace_name, kubernetes.pod_name, kubernetes.host), which removes the need to collect (and locate!) logs node by node and pod by pod.
AWS-level sources
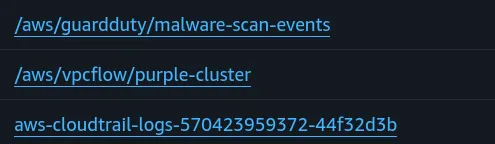
| Source | Role | Notes |
|---|---|---|
| GuardDuty | Managed threat detection | EKS Protection8 (audit-log analysis) and the optional Runtime Monitoring9 (eBPF agent, syscalls) |
| CloudTrail10 | AWS API activity |
|
| VPC Flow Logs11 | Network metadata |
Delivered to CloudWatch Logs, S3 or Firehose. Note: Attributing a flow to a pod requires correlating the ENI IP address with a time-stamped cluster inventory. There is no native Kubernetes context field (only ECS has one) |
Nodes and certain pods carry an AWS identity: the node IAM role, or IRSA12 / EKS Pod Identity13 for workloads. When a node or pod is compromised, that identity can be abused on other AWS resources, and the node role is especially sensitive, as it can itself distribute credentials for the pod roles on the cluster. CloudTrail retains the corresponding API activity.
Investigation tooling
CloudWatch Logs Insights
Logs Insights is the console used to query every log group with an SQL-like language. The following generic queries operate on the EKS audit logs.
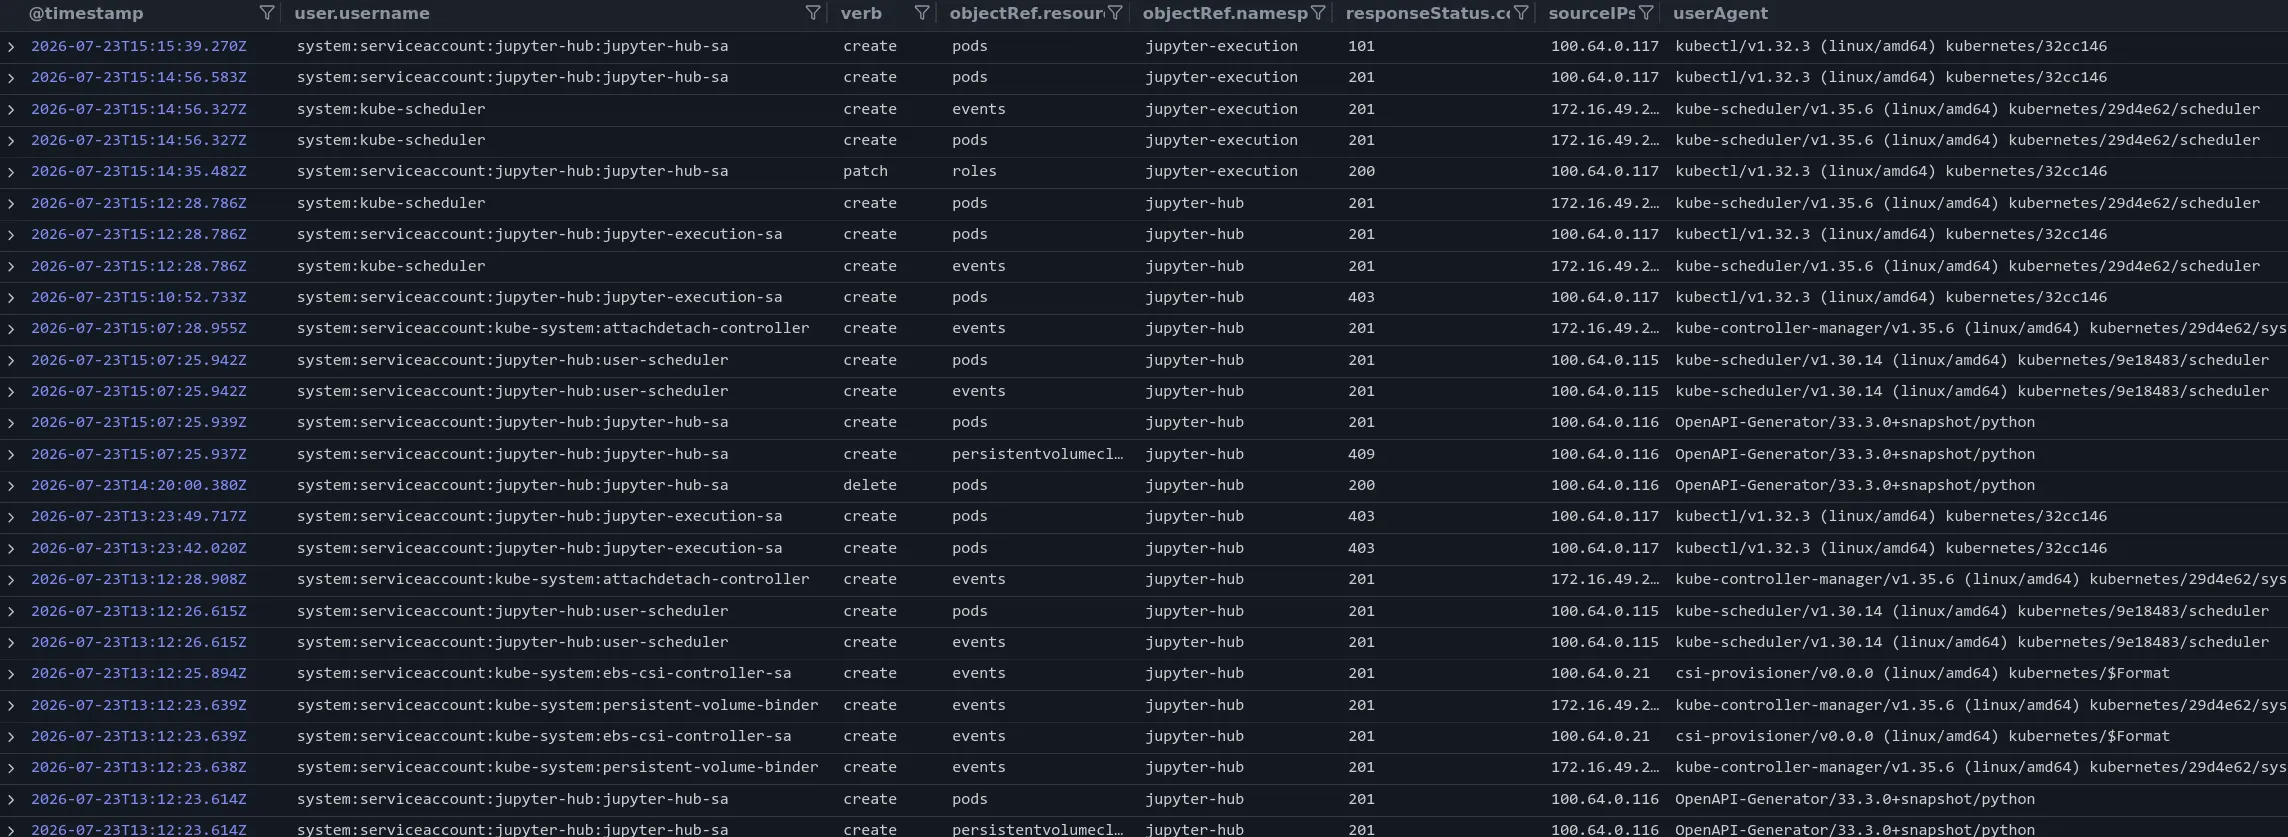
Mutating actions, grouped by identity:
fields @timestamp, user.username, verb, objectRef.resource, objectRef.namespace,
       responseStatus.code, sourceIPs.0, userAgent
| filter verb in ["create", "update", "patch", "delete"]
| sort @timestamp desc
This query is deliberately broad and returns a lot of output. Narrowing it to a known indicator, such as a ServiceAccount, a source IP address, or a pod or namespace name taken from a GuardDuty finding, restricts the results to the activity around a suspected identity and time. For instance the following results while searching specific namespaces (jupyter) :
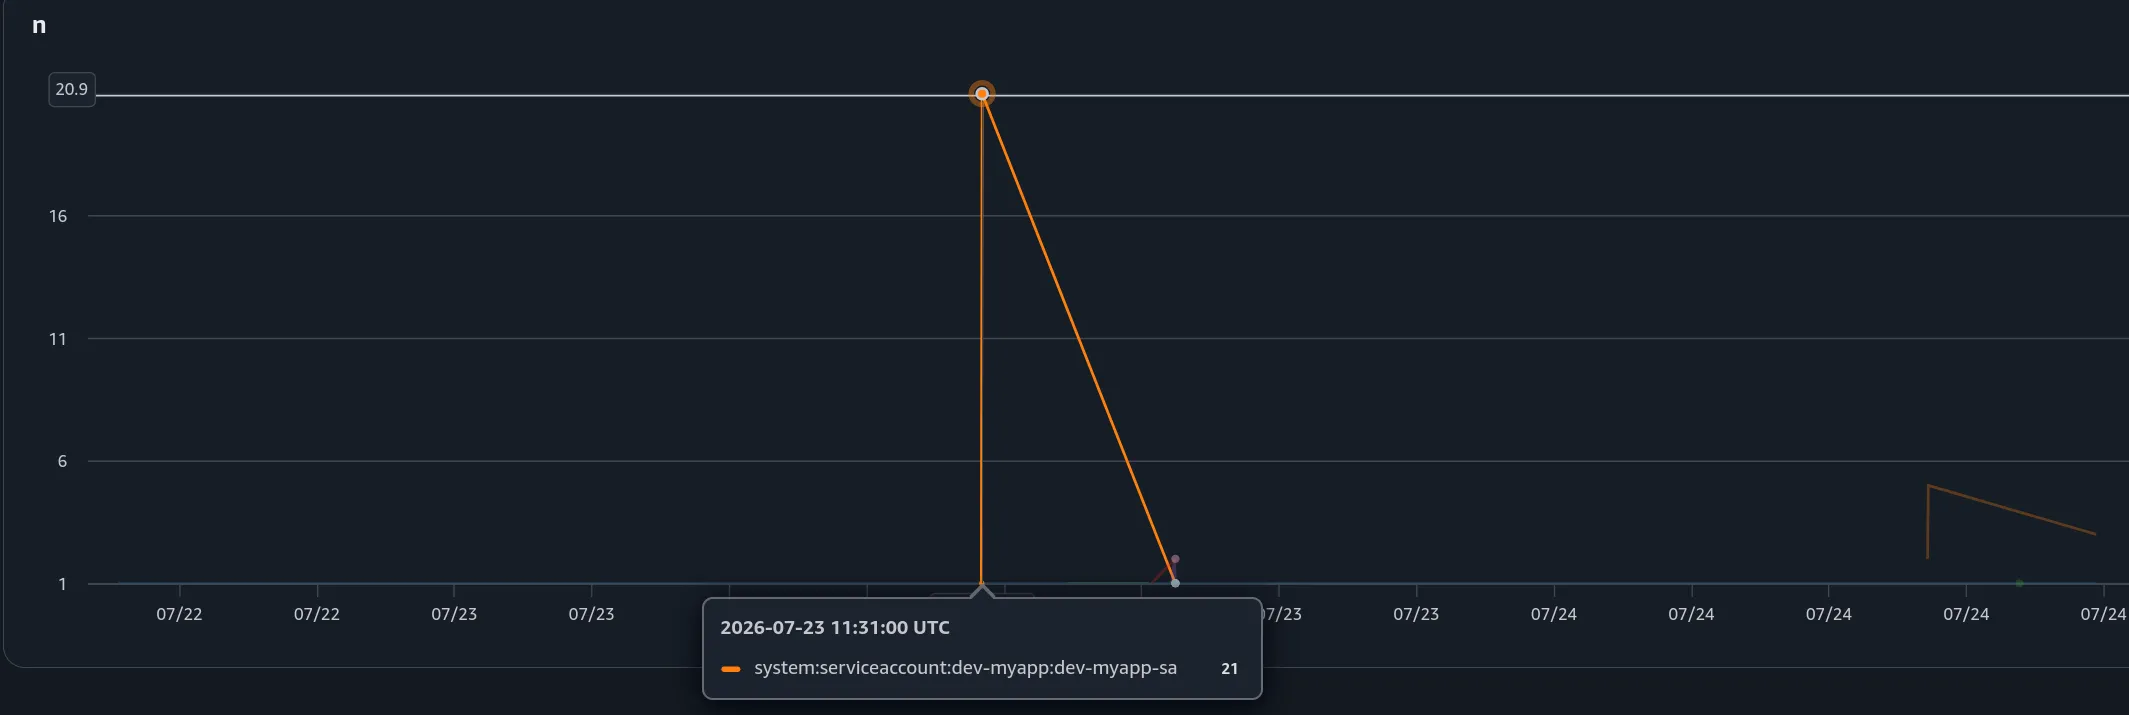
A burst of SelfSubjectAccessReview and SelfSubjectRulesReview objects reveals RBAC reconnaissance: a principal enumerating its own privileges namespace by namespace, as kubectl auth can-i --list does:
fields @timestamp, user.username, sourceIPs.0
| filter objectRef.resource in ["selfsubjectreviews", "selfsubjectrulesreviews"]
| stats count(*) as n by user.username, bin(1m)
| sort n desc
Modifications to RBAC roles, the pivotal step of an in-cluster escalation. The escalate14 verb on a role lets a principal broaden its own permissions by editing that role. The applied rule set is visible in the requestObject:
fields @timestamp, user.username, objectRef.namespace, verb, objectRef.name, sourceIPs.0
| filter verb in ["update", "patch"]
| filter objectRef.resource in ["roles", "clusterroles"]
| sort @timestamp desc

The applied rule set is read from the raw event.
Pod creations denied by Pod Security Admission (Result code is HTTP 403), a reliable indicator of an evasion attempt:
fields @timestamp, user.username, objectRef.namespace, responseObject.message
| filter verb = "create" and objectRef.resource = "pods" and responseStatus.code = 403
| sort @timestamp desc

A node account evaluating its own permissions, which a legitimate kubelet never does:
fields @timestamp, user.username, verb, objectRef.resource, sourceIPs.0, userAgent
| filter user.username like "system:node:"
| filter objectRef.resource in ["selfsubjectrulesreviews", "selfsubjectaccessreviews"]
| sort @timestamp desc

Beyond the audit trail, the Container Insights groups hold the workload and host logs. The same query language applies, using the enriched Kubernetes attributes (@entity.Attributes.K8s.Namespace, @entity.Attributes.K8s.Workload); filterIndex @data_source_name in ["amazon_eks"] narrows a search to the EKS-sourced entries.
Application logs are particularly useful for the components that sit in front of the workloads. A reverse proxy or ingress controller (e.g. Traefik) records the client source IP address that downstream application logs often drop, which makes it possible to attribute an action to an external address even when the target service only ever logs an internal one:
fields @timestamp, @entity.Attributes.K8s.Namespace, @entity.Attributes.K8s.Workload, log
| filter @entity.Attributes.K8s.Namespace = "traefik"
| sort @timestamp desc

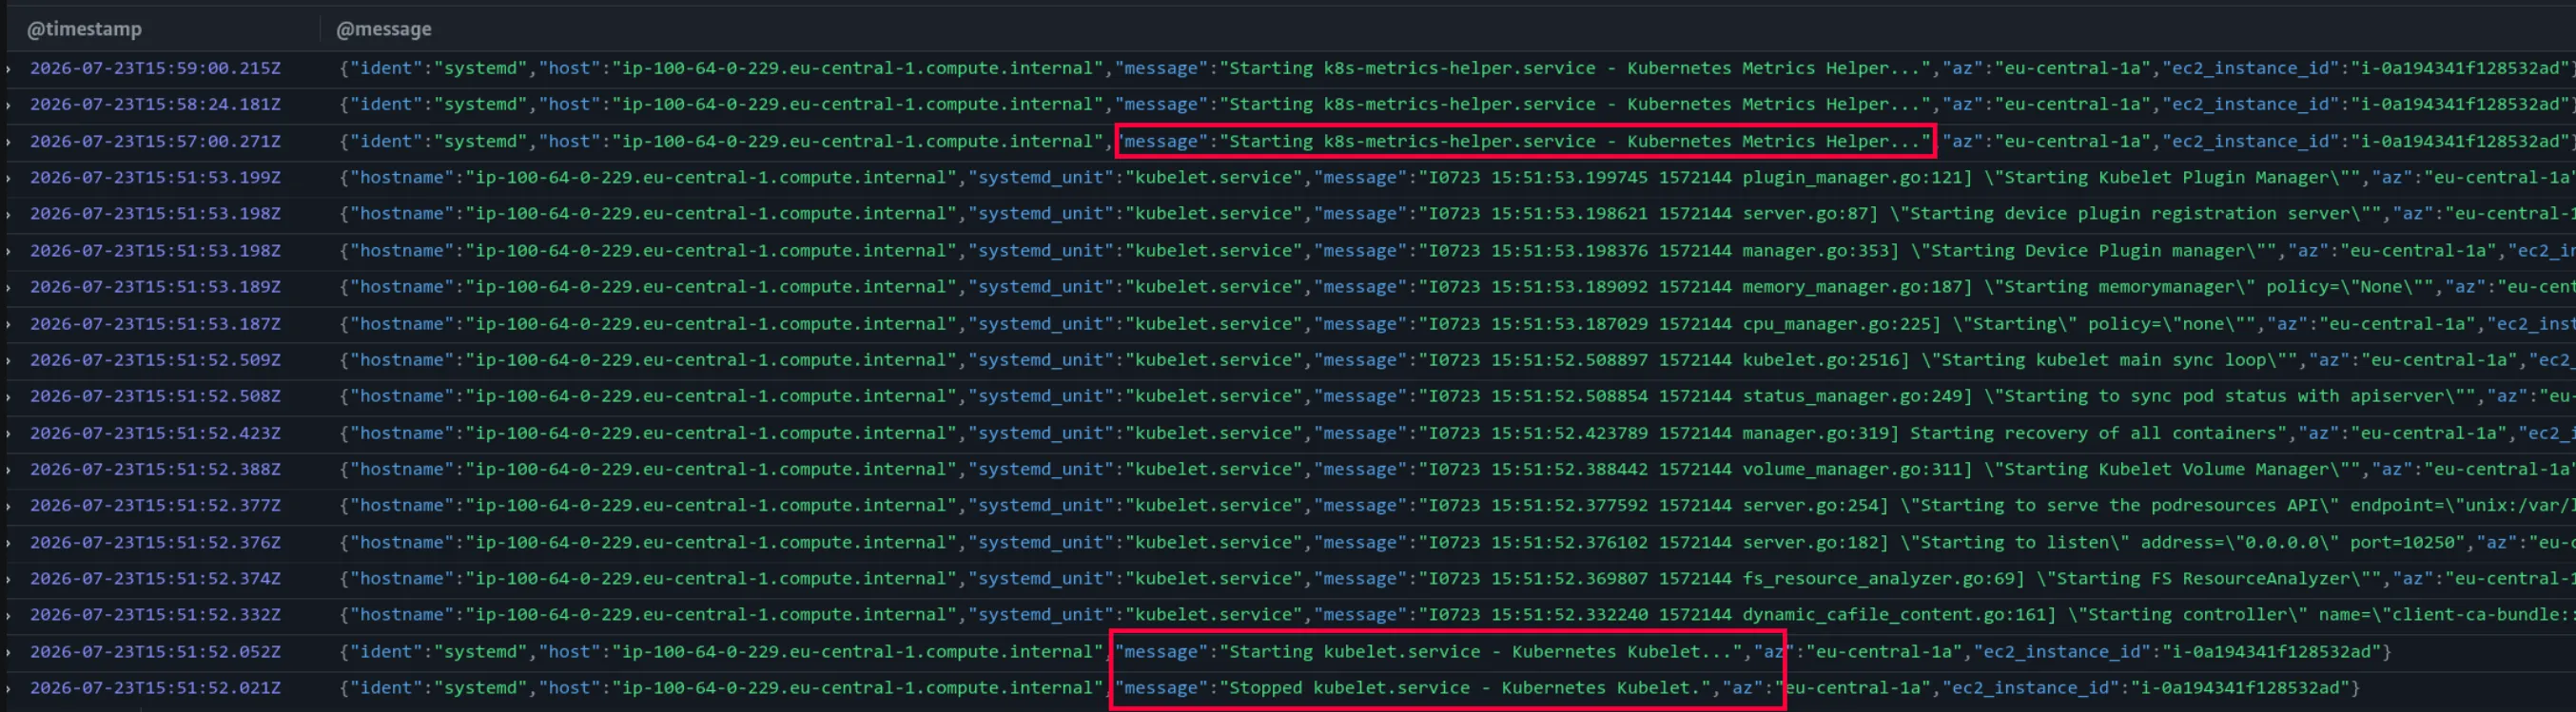
Host logs (/aws/containerinsights/[cluster]/host) cover the worker operating system: filtering on sshd, sudo or systemd surfaces node-level activity such as an added service or an interactive login.
fields @timestamp, @message
| filter (@message like "kubelet" and @message like "systemd" and @message like "Stopped") or (@message like "systemd" and @message like "Starting")
| sort @timestamp desc
GuardDuty
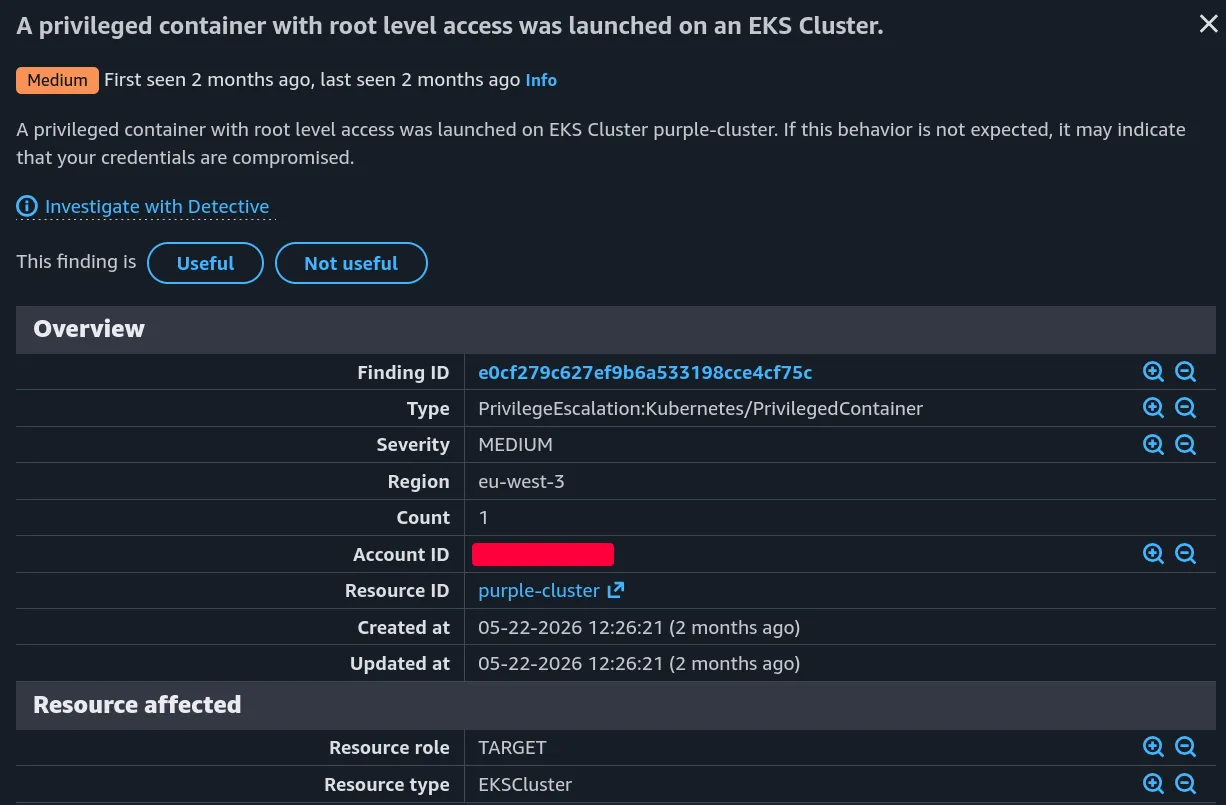
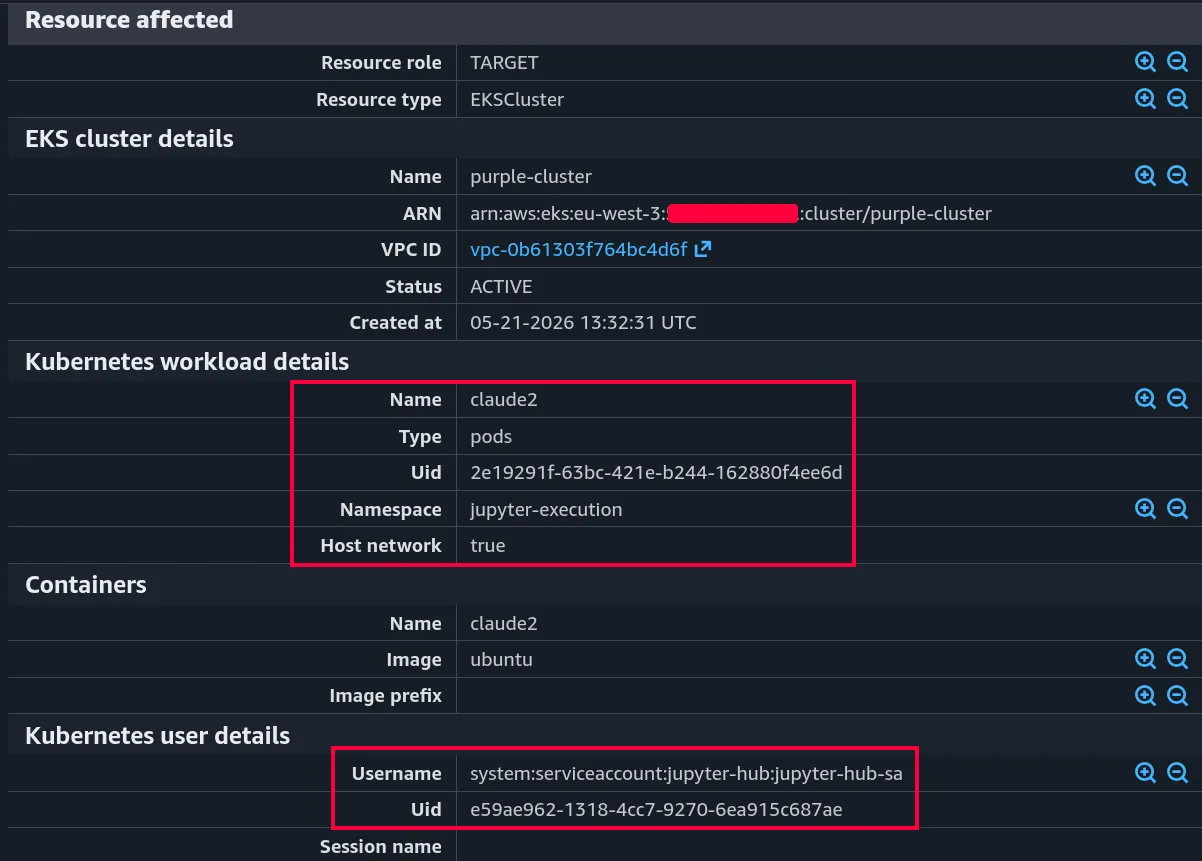
GuardDuty is commonly the first alert source. With EKS Protection, each cluster-related finding carries the Kubernetes context: cluster, namespace, pod, ServiceAccount, and the source IP address of the API request. A few representative findings show what that context provides.
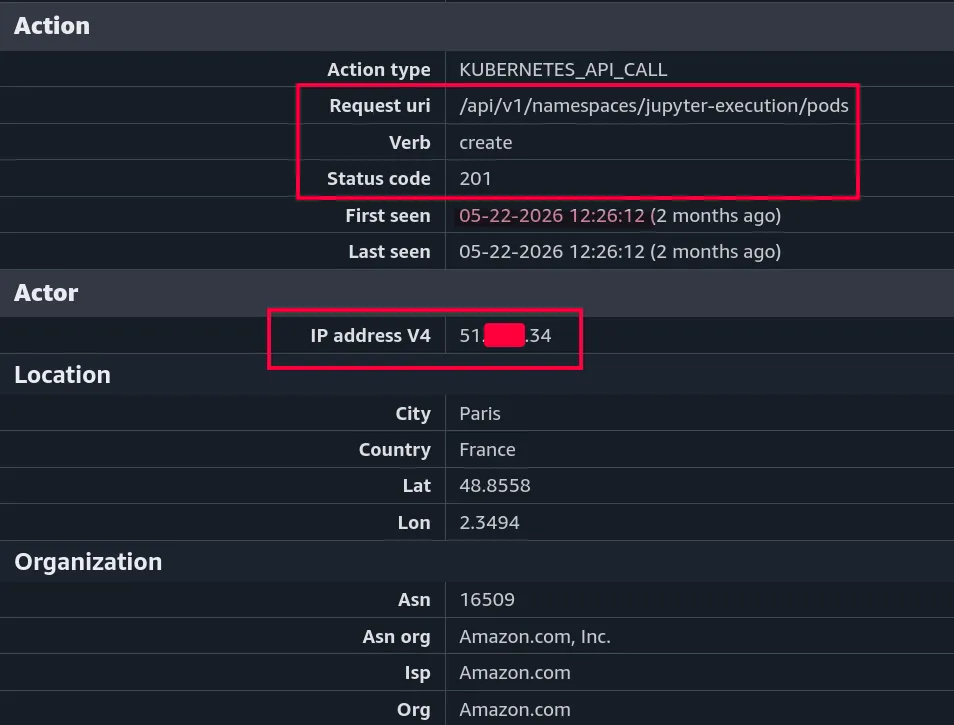
PrivilegeEscalation:Kubernetes/PrivilegedContainer flags a privileged container launched with root-level access. On its own this is not suspicious, CNI plugins, CSI drivers and monitoring agents legitimately run privileged, so the value of the finding lies in the context it carries. Besides the pod name and namespace, it names the ServiceAccount that created the pod, and its Action section exposes the API call and the source IP address behind it, sometimes an external address. A privileged pod created by an application ServiceAccount, from an unexpected IP address, outside the usual infrastructure namespaces, is what distinguishes a routine deployment from a lead worth digging into.
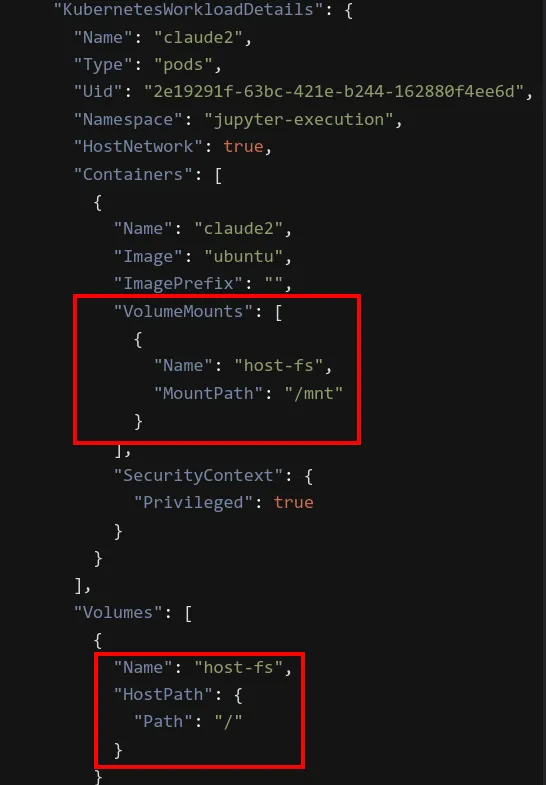
Persistence:Kubernetes/ContainerWithSensitiveMount flags a container started with a sensitive host path mounted inside it. The finding shows the mount in the container definition, typically the node root / bound to a directory such as /mnt, which gives an attacker who controls the pod a way to modify the node and establish persistence.

Exporting the GuardDuty finding as JSON is a good way to obtain the full detection details, including fields that the console does not display:
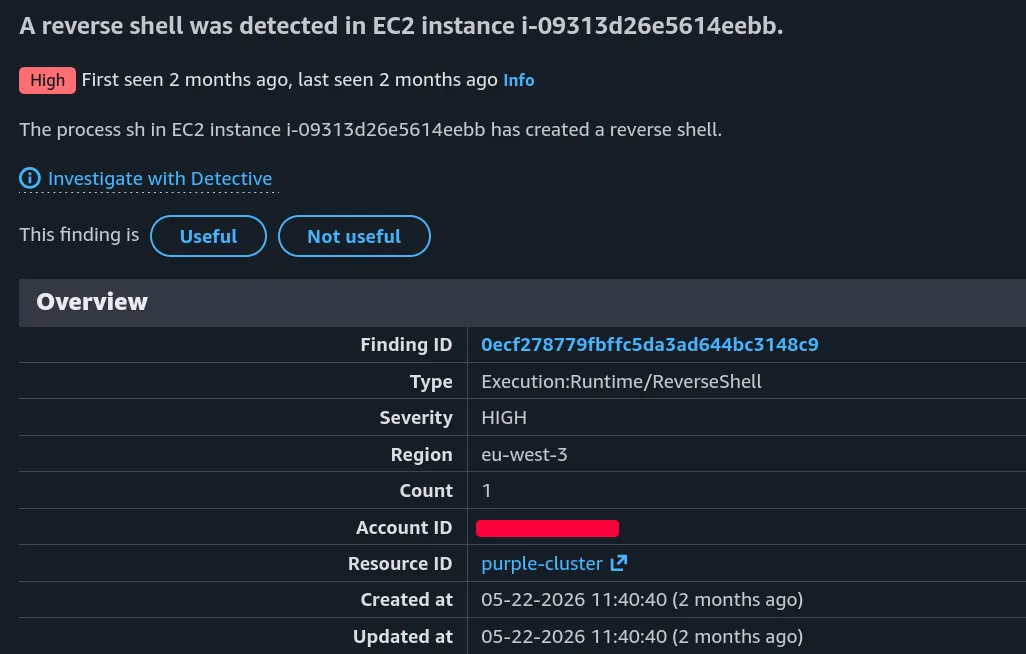
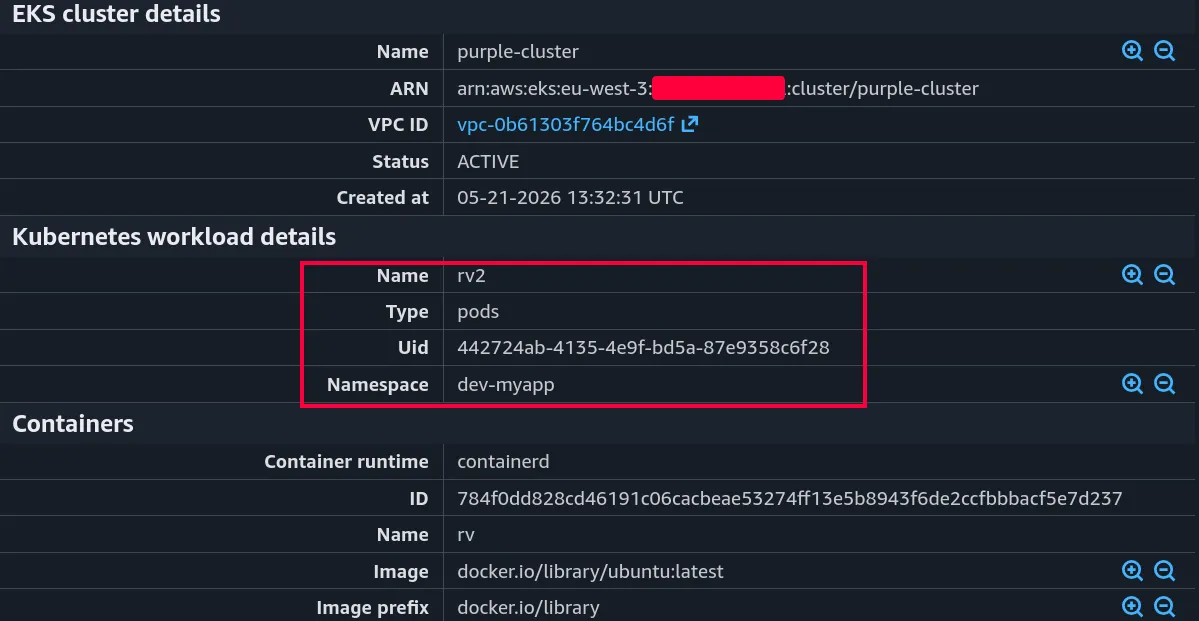
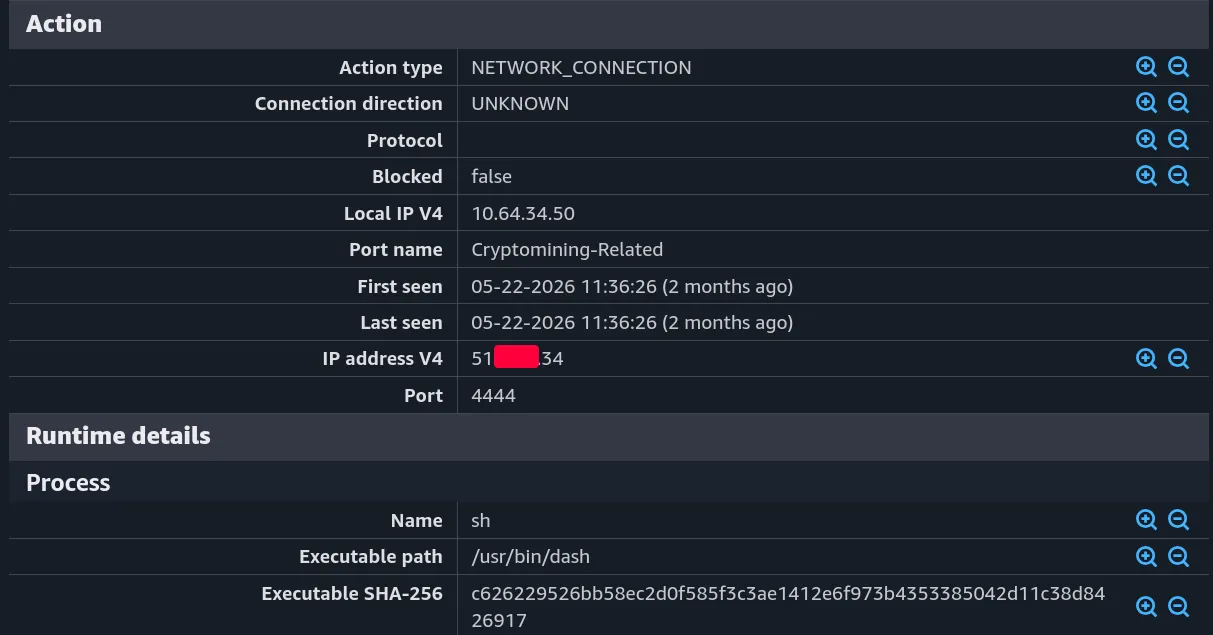
Execution:Runtime/ReverseShell is raised by Runtime Monitoring when a shell with a redirected network connection runs inside a container. Because the eBPF agent supplies the process lineage, the finding traces the bash process back to the exact pod it came from.
UnauthorizedAccess:IAMUser/InstanceCredentialExfiltration.OutsideAWS (or .InsideAWS) is an EC2/IAM finding rather than an EKS one, but it is central to EKS intrusions: it reports that the credentials of the node's IAM role were used from an external IP address, the sign of a stolen node identity replayed outside the cluster (see the CloudTrail section below).
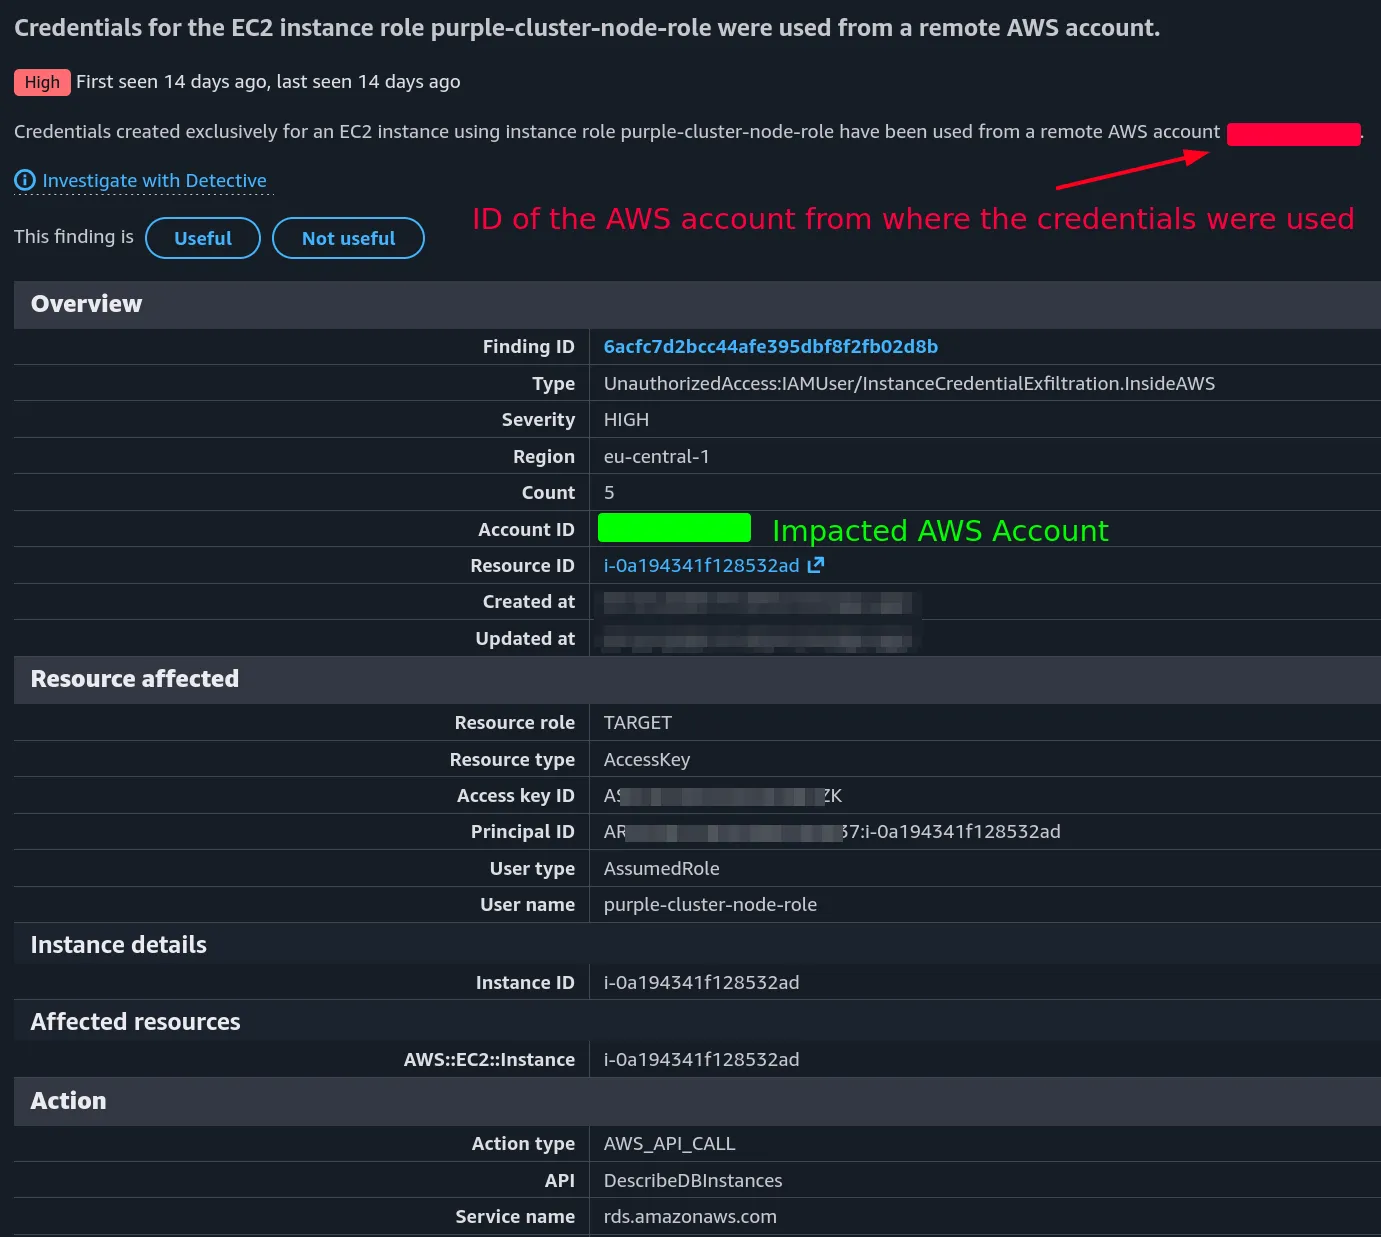
Recap of the few GuardDuty findings (not an exhaustive list):
| Finding | Description |
|---|---|
PrivilegeEscalation:Kubernetes/PrivilegedContainer |
A privileged, root-capable pod was created |
Persistence:Kubernetes/ContainerWithSensitiveMount |
A pod mounts a sensitive host path (node escape) |
Execution:Runtime/ReverseShell |
A reverse shell runs inside a container (Runtime Monitoring) |
UnauthorizedAccess:IAMUser/InstanceCredentialExfiltration.OutsideAWS|InsideAWS |
Node role credentials were used from an external IP address |
Two limitations are worth noting. GuardDuty is a black box: the detection rules are undisclosed and cannot be extended, though the finding-type reference15 documents the full catalogue. And Runtime Monitoring16 (syscall visibility through an eBPF security agent) is optional, deploys additional pods, and does not support EKS clusters running on Fargate. Without it, in-container coverage is partial and the audit logs remain the primary in-cluster record. A finding is always a lead to confirm there, never a verdict.
CloudTrail
When an attacker obtains a node identity (through the IMDS) or a pod identity (through IRSA or Pod Identity), the resulting AWS API calls are recorded by CloudTrail.
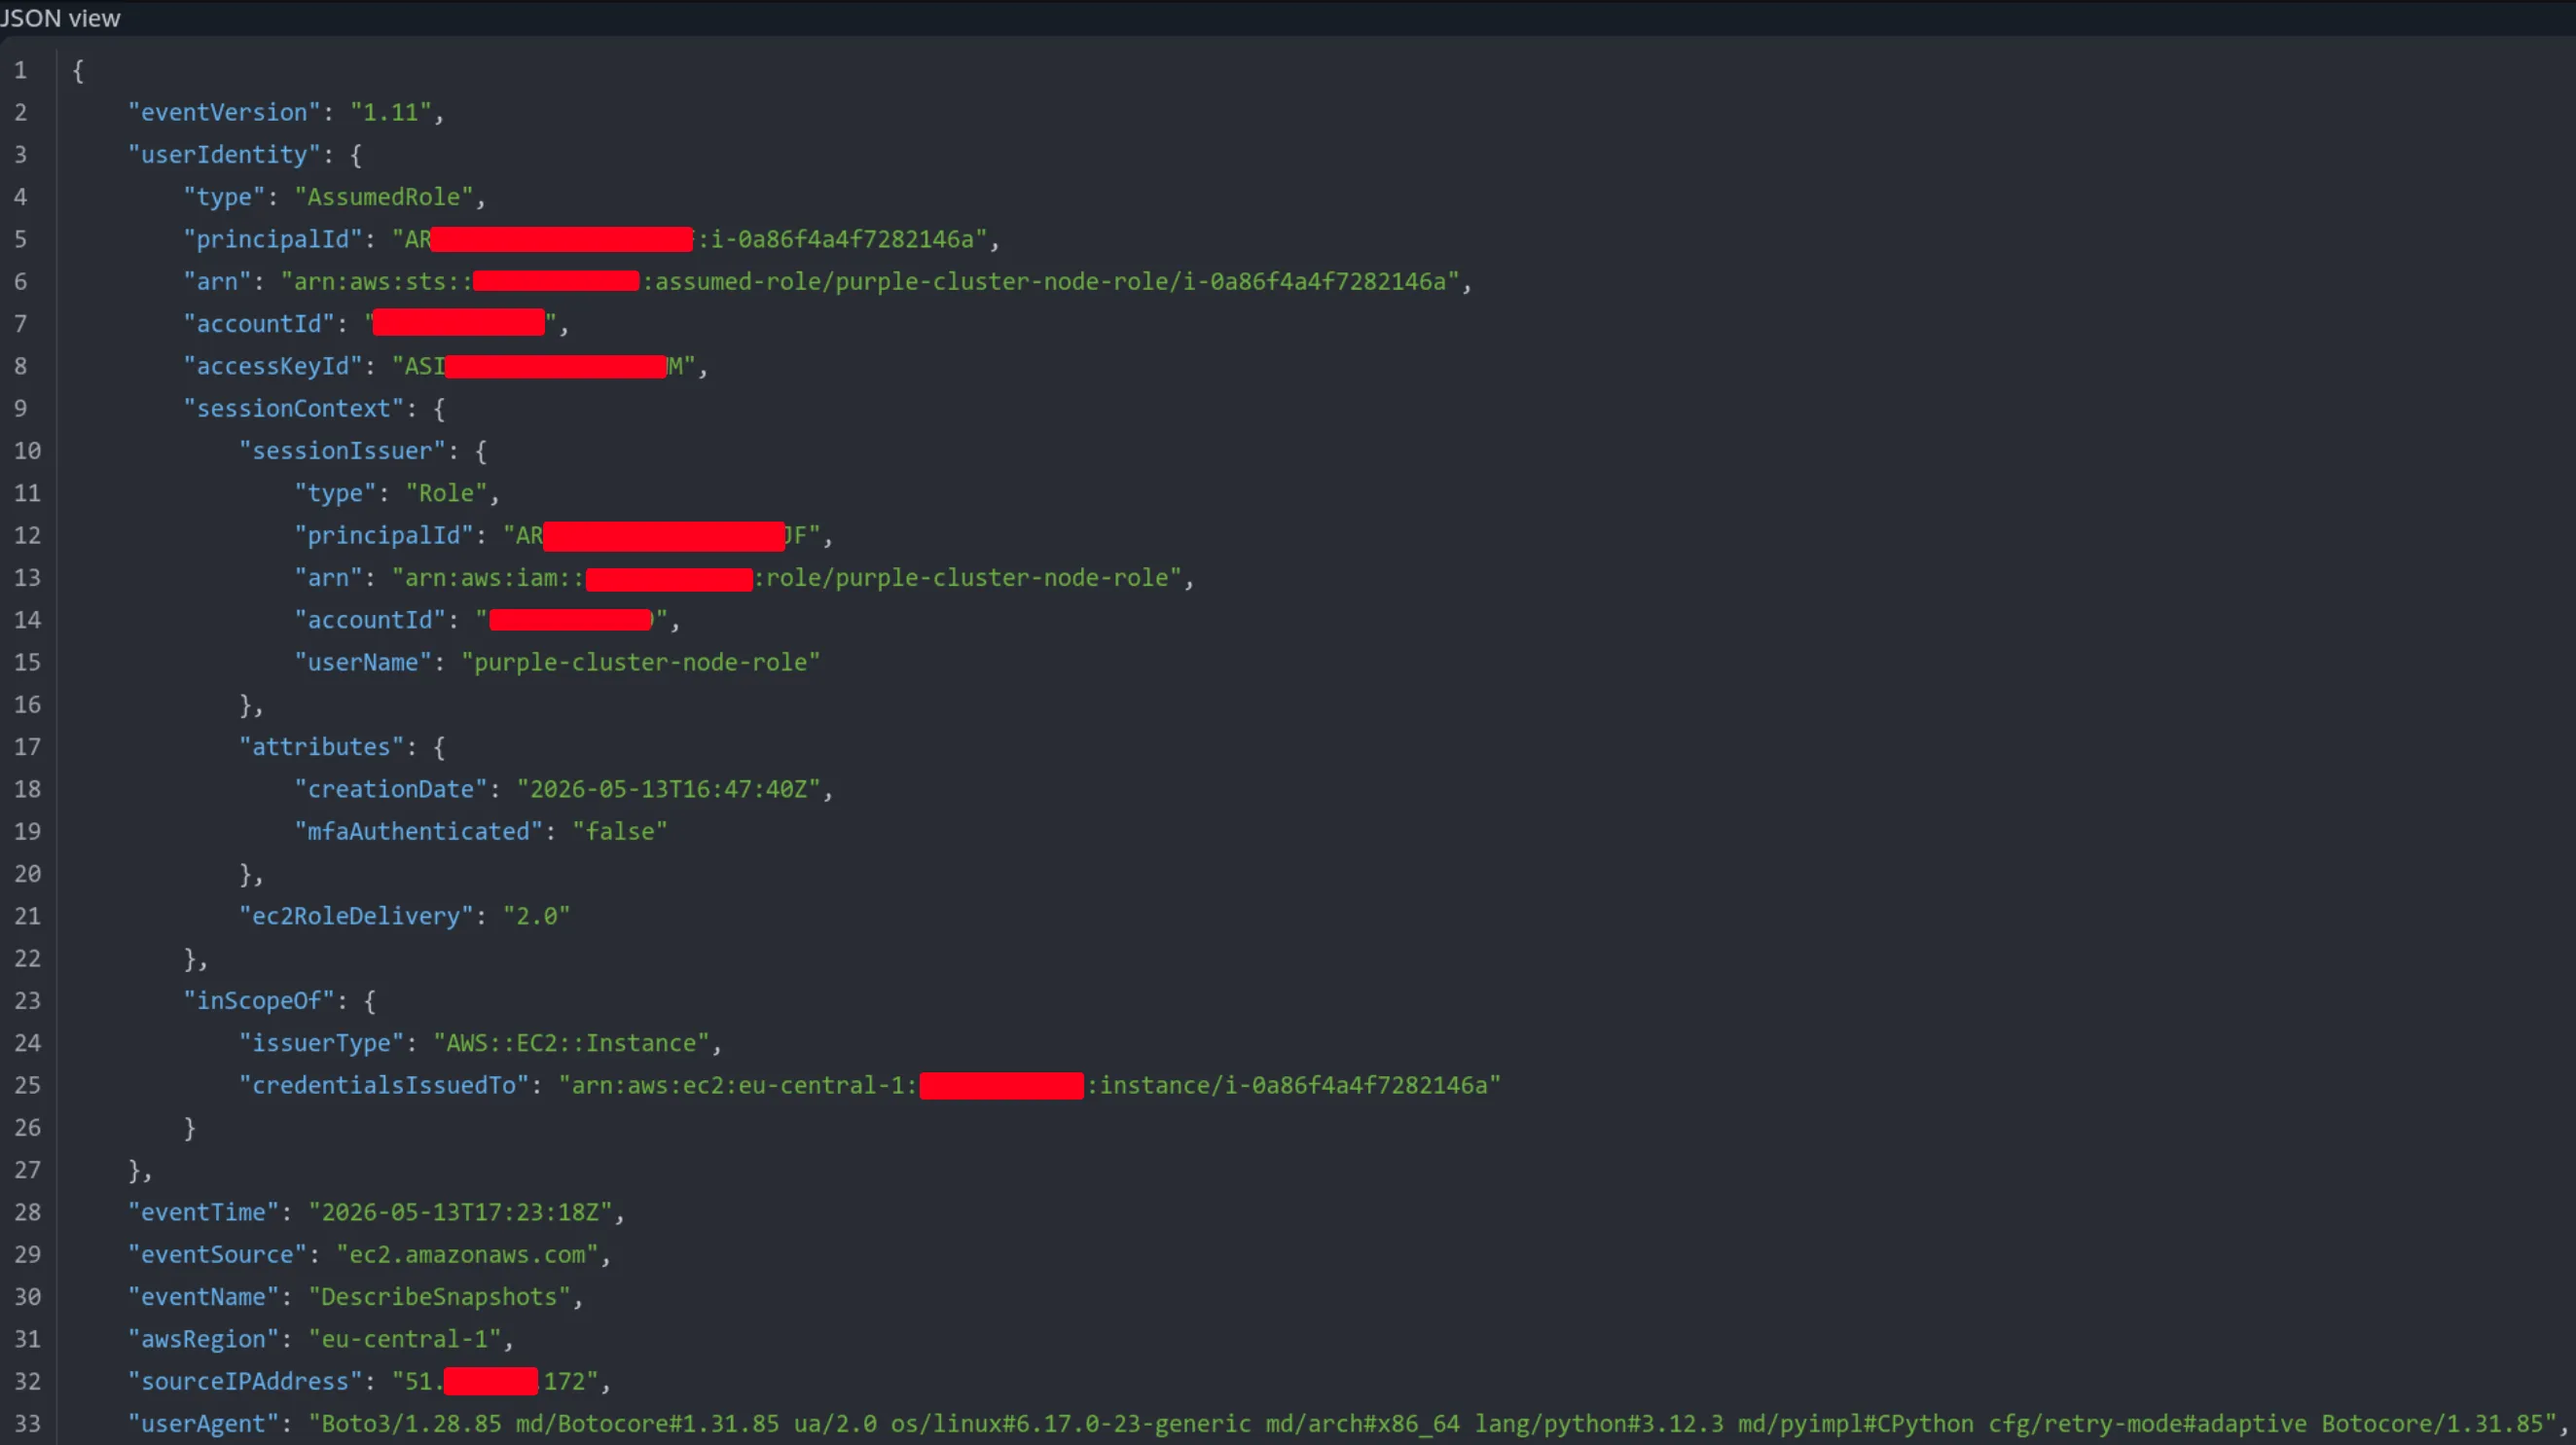
The node role activity can be isolated by excluding the cluster's node subnets and NAT gateway egress:
fields @timestamp, eventName, sourceIPAddress, userAgent
| filter userIdentity.arn like "<node-role-name>"
| filter not (sourceIPAddress like /^10\.0\./) and sourceIPAddress != "<nat-gateway-eip>"   # node subnets (10.0.0.0/16) + NAT egress
| stats count(*) as n by eventName, sourceIPAddress
| sort n desc
A burst of read calls (Describe*, List*, Get*) from an IP address outside of the cluster's egress, with an aws-cli user agent, is characteristic of cloud-resource discovery from a stolen token.
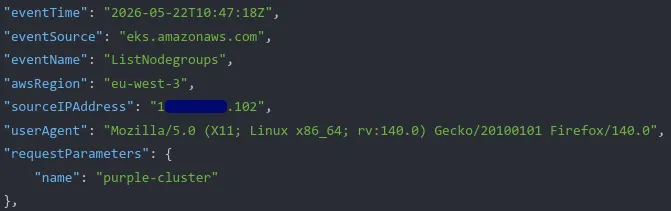
The eks.amazonaws.com event source likewise records administrator actions against the cluster itself.

kubectl
With an EKS administrator account, kubectl remains an efficient way to capture live context: RBAC roles and bindings, the definition of a suspicious pod (kubectl get pod [pod id] -o yaml), cluster events, and ServiceAccounts. It is the quickest route to identifying a dangerous rule such as the escalate verb on roles.
Node-level acquisition
On a standard cluster, worker access over SSH or SSM Session Manager17 enables system-level collection:
$ aws ssm start-session --target [node instance-id]
When neither SSH nor SSM is available, kubectl debug node/[node] schedules a pod that mounts the host filesystem under /host, giving node access. It is a last-resort route rather than a preferred one: it adds a workload to the node being under examination, leaving fresh create pods entries in the audit log. When no less intrusive access exists, it should be used deliberately and documented.
The node hosts the ServiceAccount tokens of the pods scheduled on it, mounted as projected volumes and a common theft target:
$ find /var/lib/kubelet/pods -path "*/kubernetes.io~projected/*/token" -type f
At the Kubernetes level, the kubelet checkpoint API18 (Beta since v1.30 but enabled by default) can freeze a container's state into an offline archive without terminating it. It relies on CRIU through the CRI runtime, which the EKS-optimized AMIs do not currently ship with, so the technique is not usable on EKS as of this writing. We plan to cover container checkpointing on Kubernetes in a future article.
Use case: Detecting node-level persistence
Once an attacker reaches the node, persistence is a common objective, and it leaves distinctive traces across the sources above. Among the known mechanisms, the static pod19 stands out: a manifest dropped directly on the node, which the kubelet picks up and runs outside the normal API-driven workflow.
On the EKS-optimized AMIs, the kubelet does not watch a manifests directory by default: staticPodPath is absent from its configuration (/etc/kubernetes/kubelet/config.json), so the technique first requires setting it to a directory (for instance /etc/kubernetes/kubelet/manifests) and reloading/restarting the service. That prerequisite is itself an artifact observable on the node before the pod event exists.
When the kubelet loads a manifest from the staticPodPath (/etc/kubernetes/kubelet/manifests) and starts a container on its own, it registers a mirror pod on the API server so the pod is visible through kubectl. GuardDuty raises the corresponding Execution:Kubernetes/AnomalousBehavior.WorkloadDeployed finding ("a workload was launched in an unusual way").
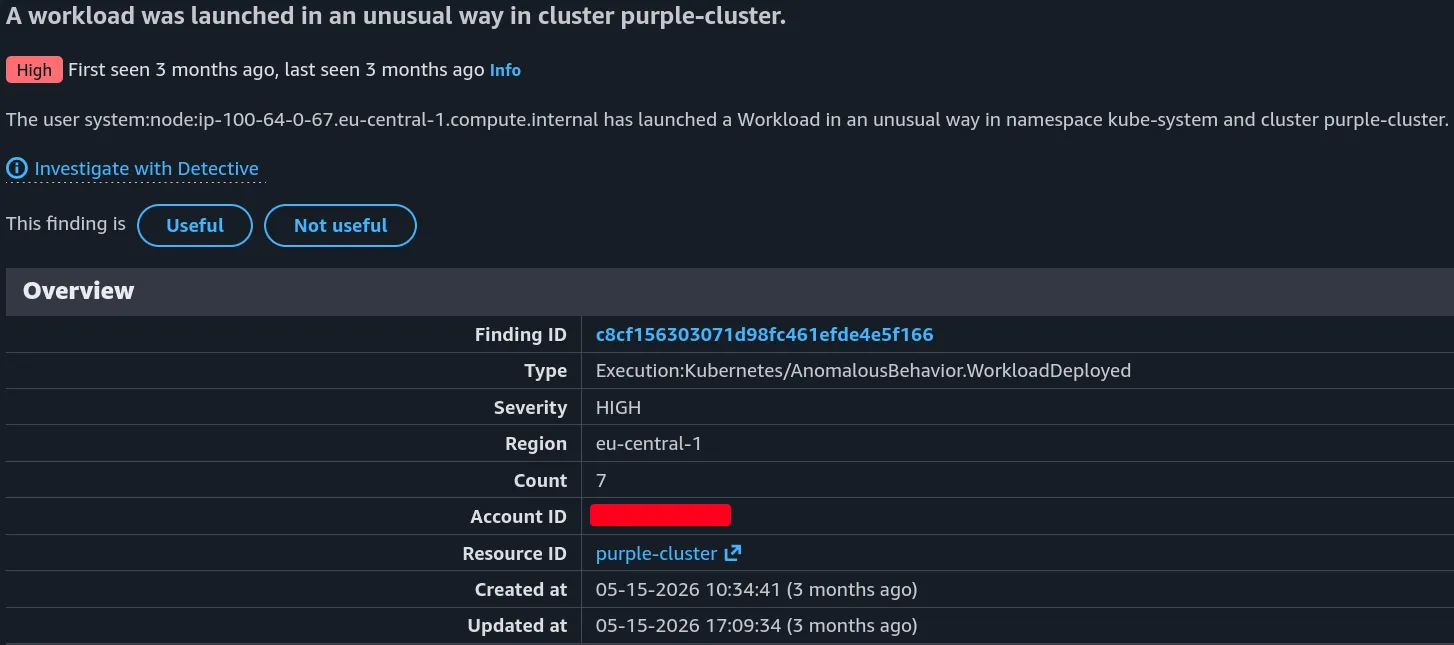
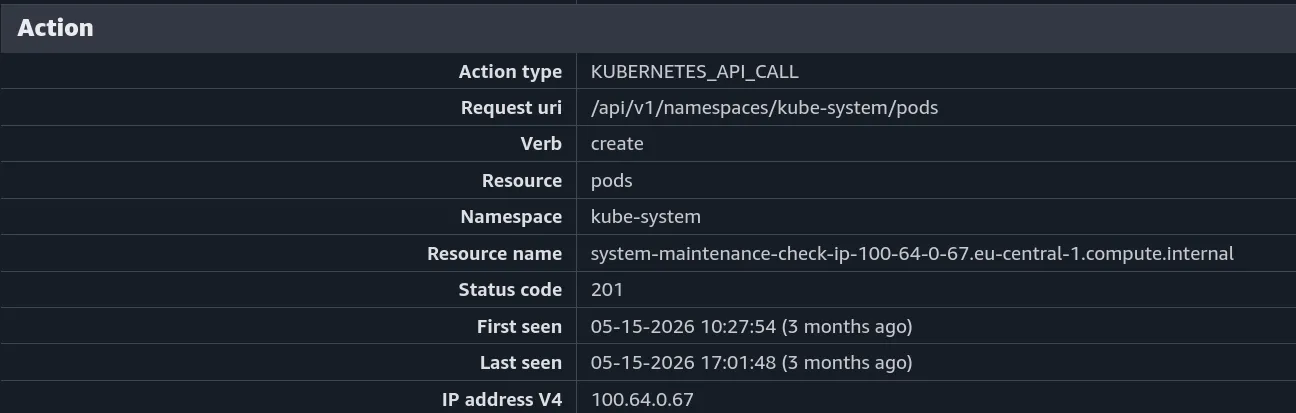
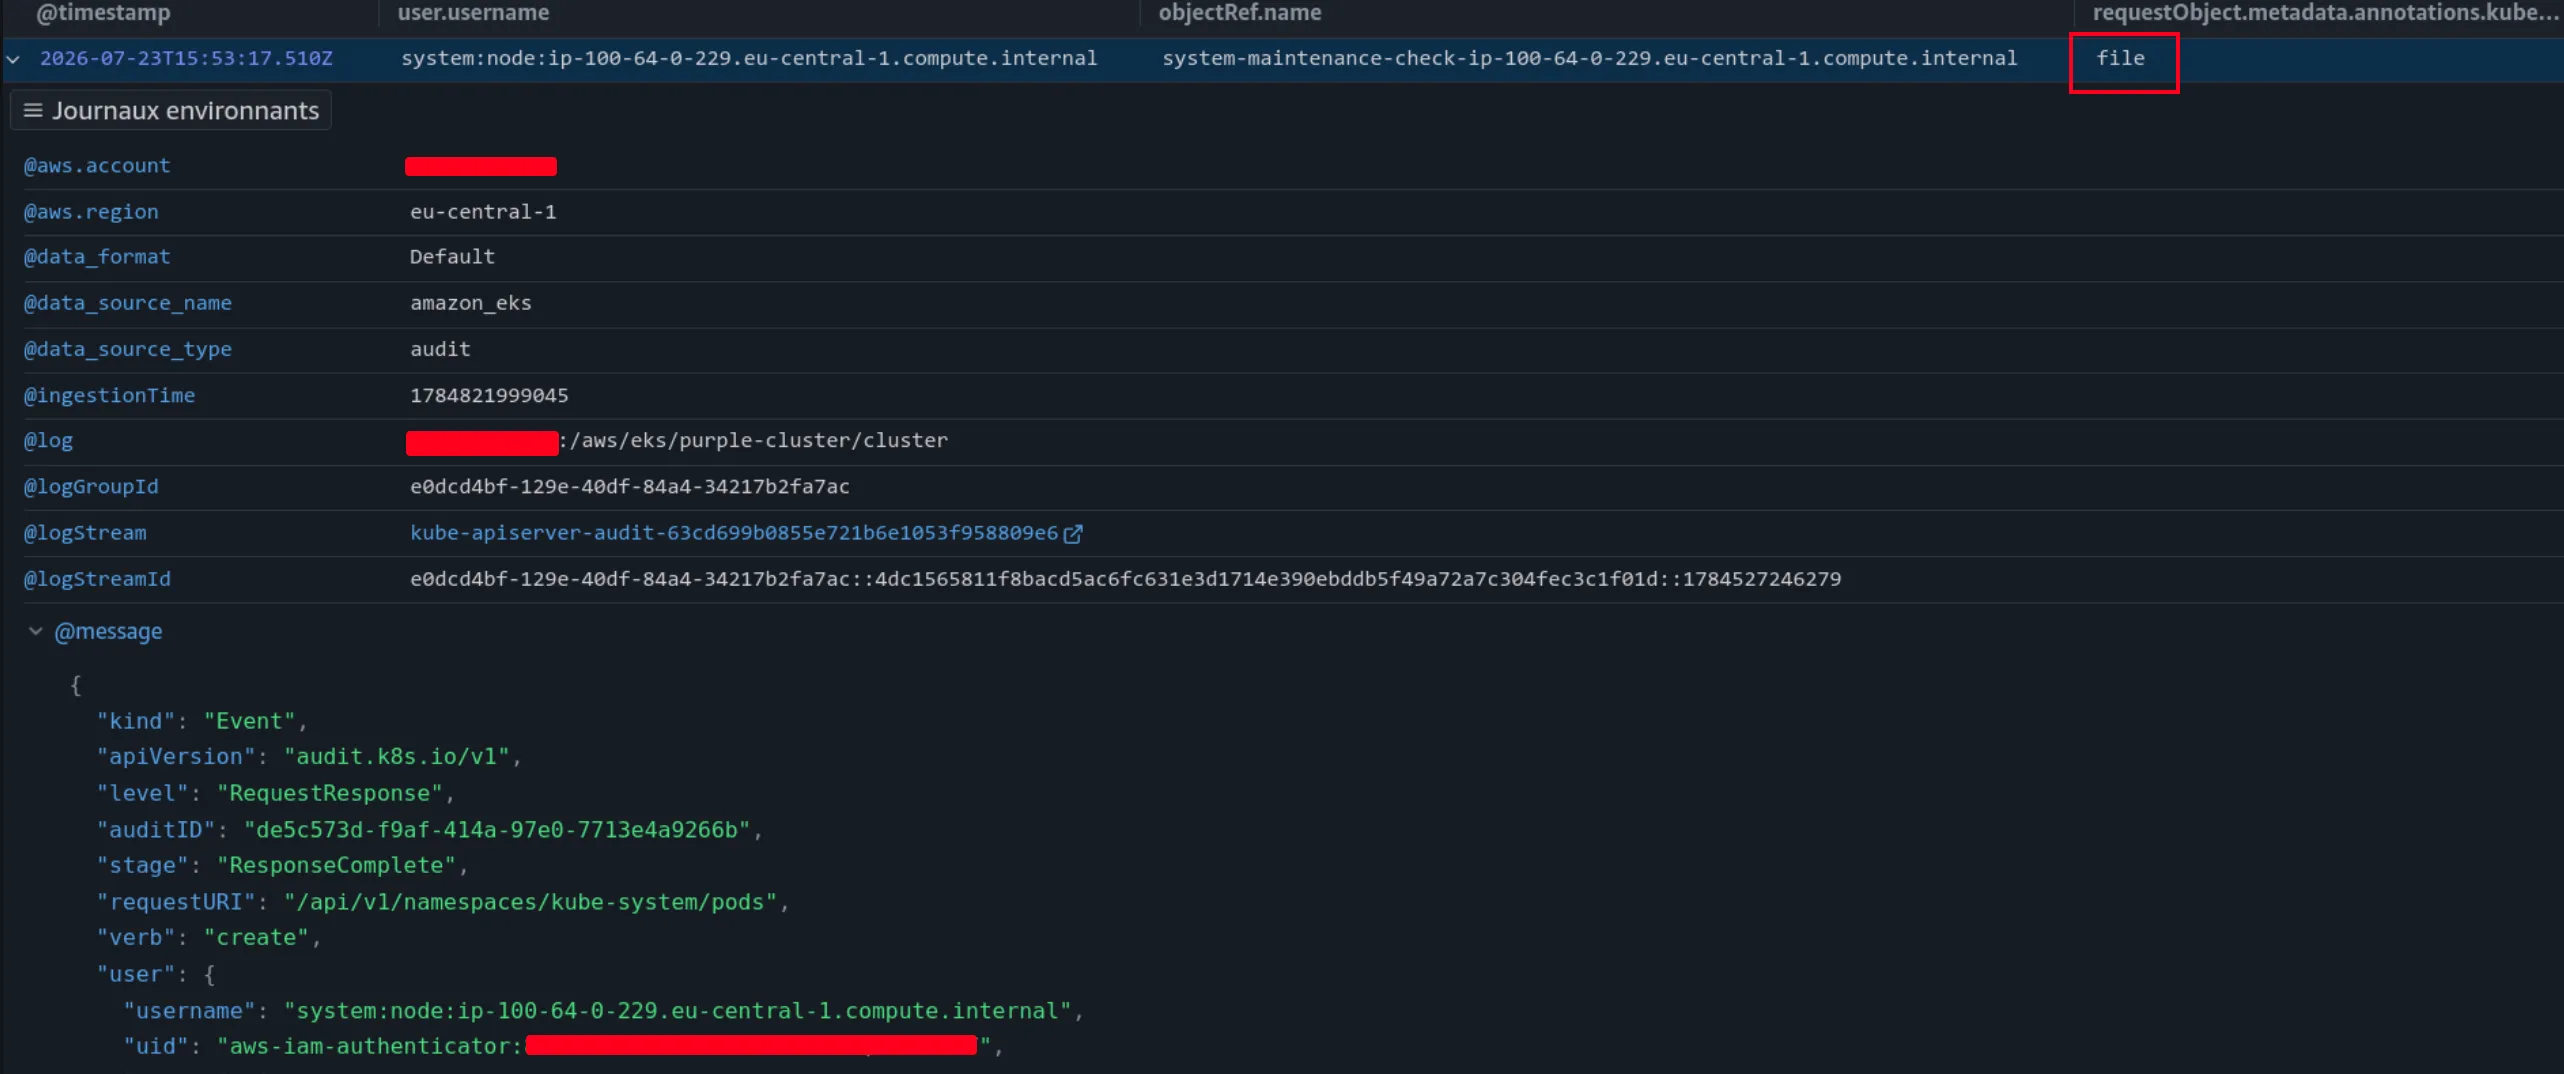
From that lead, the audit log confirms the mechanism: the pod is created by a system:node: identity and carries the annotation kubernetes.io/config.source = "file" (instead of "api"), conclusive evidence of a static pod placed directly on the node's disk.
fields @timestamp, user.username, objectRef.name,
       `requestObject.metadata.annotations.kubernetes.io/config.source` as config_source
| filter verb = "create" and objectRef.resource = "pods"
| filter user.username like "system:node:"
| sort @timestamp desc
Investigation approach
Preparation
Most of the investigation's outcome is decided before the incident, because EKS emits almost none of the relevant telemetry by default.
Control plane audit logging, with a decent retention window, produces the in-cluster timeline. Container Insights and similar add the workload and host logs. GuardDuty EKS Protection, with Runtime Monitoring warranting in-container visibility, provides managed detection. Finally, CloudTrail records the AWS-level activity of administrators as well as node and pod identities.
Hardening narrows the impact of a compromise:
- Permission boundaries on the node and pod IAM roles cap what a stolen identity can reach,
- a restricted Pod Security Admission20 policy on the namespaces that do not need privileges blocks the usual node-escape primitives,
- and least-privilege ServiceAccounts limit what a compromised token grants.
Containment
Once a compromise is detected, containment usually interferes with evidence preservation. kubectl delete is the reflex to avoid: deleting or restarting a pod discards the process state, the writable (upper) layer and the projected tokens the analysis depends on, and a controller may immediately reschedule the workload elsewhere.
Isolation is better achieved at the network level, with NetworkPolicies and Security Groups, while keeping liveness and readiness probes satisfied so the pod is neither killed nor moved. When an AWS identity has been stolen, however, revoking or rotating the node role credentials and the leaked ServiceAccount tokens is what actually cuts the attacker's access: network isolation alone does not, since a stolen token can be replayed from anywhere.
Kubernetes-native containment techniques deserve their own treatment and will be covered in a dedicated article later in this series.
Acquisition
Collection is a race against the pod lifecycle: a running pod's memory, process state and writable layer are gone the moment it restarts, taking the projected ServiceAccount tokens held on its node with them, whereas the centralised CloudWatch logs are durable and can be retrieved later.
The live pod and those node-local tokens therefore come first. An administrator kubectl session then captures the context the logs do not always make explicit: RBAC definitions, pod specifications, attached volumes.
Analysis
The investigation is driven by two pivots carried across the three layers: the acting identity and the source IP address.
- A GuardDuty finding or a reported anomaly is the usual entry point, treated as a lead rather than a verdict. It highlights an identity (a
user.username, a ServiceAccount, or an IAM role ARN) and a source IP address, and the analysis proceeds by following those two values. - Inside the cluster, the audit log reconstructs what that identity did: reconnaissance (
SelfSubjectRulesReview), RBAC changes (escalateonroles), pod creations, and so on. The application and host logs add the runtime and operating-system view: The exploit request behind the initial access (an ingress or reverse-proxy log often keeps the real client IP address), an interactive login orsudoon the node. In-container command execution remains the coverage gap that only runtime monitoring or a third-party agent fills. - Finally, the question is whether the compromise stayed in the cluster or crossed into the AWS plane. Node role credentials replayed from an external IP address surface as the
InstanceCredentialExfiltrationfinding and point the investigation into CloudTrail, where that identity's API calls are isolated by excluding the cluster's egress; a stolen pod identity is pursued the same way, without a dedicated GuardDuty finding as there is for the node role.
Joining the three layers on their shared source IP addresses, identities and timestamps yields a single timeline, which is what turns isolated events into an attack chain.
Conclusion
An EKS investigation depends almost entirely on the telemetry available beforehand. With control plane audit logging, Container Insights, GuardDuty and CloudTrail in place, CloudWatch Logs Insights and the correlation of Kubernetes and cloud events are enough to reconstruct an attack chain from the control plane down to the AWS identity of the nodes. GuardDuty provides a convenient entry point, but the audit logs and disciplined collection remain the decisive factors in the analysis.
Observed techniques can be mapped against the threat matrix for Kubernetes21 maintained by Microsoft, which is largely applicable to EKS.
If your organization needs assistance in removing doubt or responding to a security incident, please feel free to contact Synacktiv's CSIRT.
- 1. https://www.synacktiv.com/sites/default/files/2026-06/charting_your_way…
- 2. https://docs.aws.amazon.com/eks/latest/userguide/automode.html
- 3. https://docs.aws.amazon.com/eks/latest/userguide/fargate.html
- 4. https://docs.aws.amazon.com/eks/latest/userguide/control-plane-logs.html
- 5. https://docs.aws.amazon.com/guardduty/latest/ug/kubernetes-protection.h…
- 6. https://docs.aws.amazon.com/AmazonCloudWatch/latest/monitoring/install-…
- 7. https://docs.aws.amazon.com/AmazonCloudWatch/latest/monitoring/Containe…
- 8. https://docs.aws.amazon.com/guardduty/latest/ug/kubernetes-protection.h…
- 9. https://docs.aws.amazon.com/guardduty/latest/ug/runtime-monitoring.html
- 10. https://docs.aws.amazon.com/awscloudtrail/latest/userguide/cloudtrail-u…
- 11. https://docs.aws.amazon.com/vpc/latest/userguide/flow-logs.html
- 12. https://docs.aws.amazon.com/eks/latest/userguide/iam-roles-for-service-…
- 13. https://docs.aws.amazon.com/eks/latest/userguide/pod-identities.html
- 14. https://kubernetes.io/docs/reference/access-authn-authz/rbac/#privilege…
- 15. https://docs.aws.amazon.com/guardduty/latest/ug/guardduty-finding-types…
- 16. https://docs.aws.amazon.com/guardduty/latest/ug/runtime-monitoring.html
- 17. https://docs.aws.amazon.com/systems-manager/latest/userguide/session-ma…
- 18. https://kubernetes.io/docs/reference/node/kubelet-checkpoint-api/
- 19. https://kubernetes.io/docs/tasks/configure-pod-container/static-pod/
- 20. https://kubernetes.io/docs/concepts/security/pod-security-admission/
- 21. https://microsoft.github.io/Threat-Matrix-for-Kubernetes/